The Jurik PCCI Bands Indicator is a popular and free Forex Indicator for the MetaTrader 4 (MT4) platform. Designed for traders of all levels, this indicator uses the PCCI (Price Channel Center of Inertia) to create dynamic bands that help identify trend reversals, overbought and oversold conditions, and potential breakouts. By visually representing price movements in relation to the PCCI center line, traders can make informed entry and exit decisions with ease.
Understanding market trends and identifying reversals is essential for Forex trading success. The Jurik PCCI Bands Indicator simplifies this process by plotting bands above and below a center line created by the PCCI. The bands expand and contract based on Price Action, providing traders with clear visual cues about market volatility and potential trading opportunities.
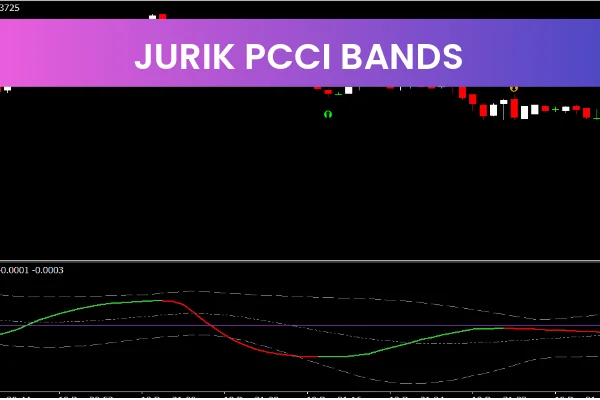
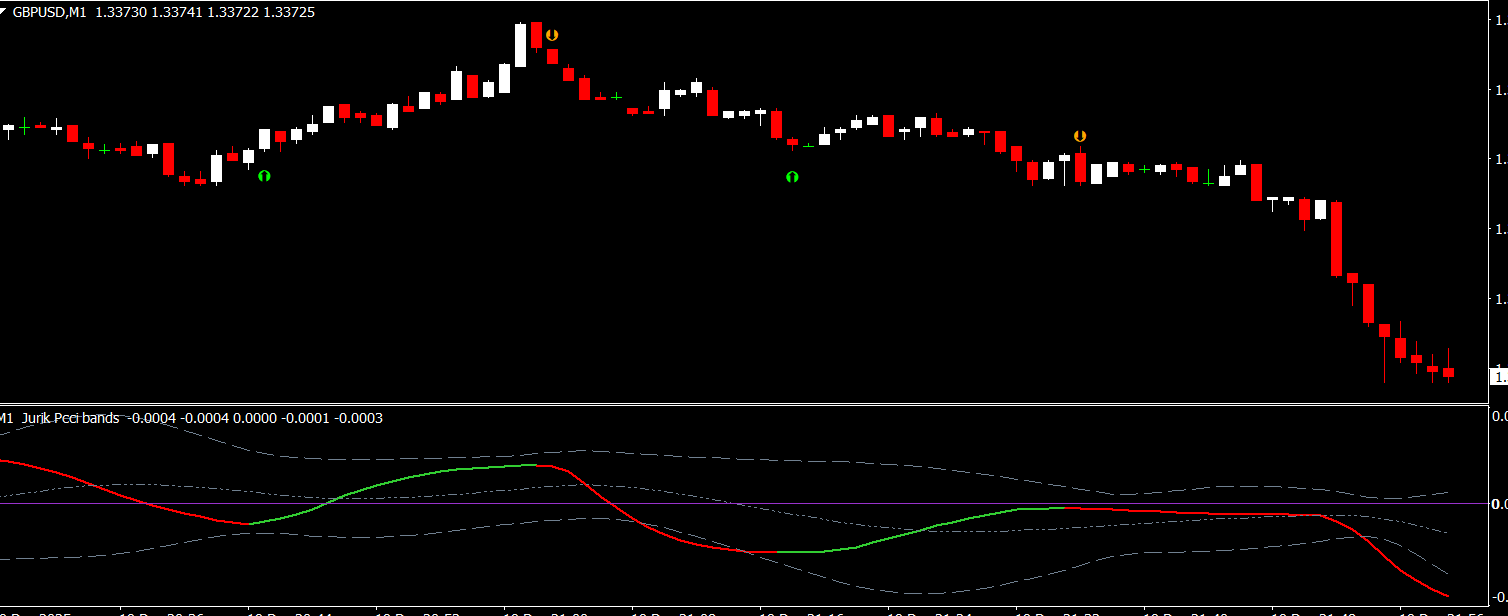
How the Jurik PCCI Bands Indicator Works
The Jurik PCCI Bands Indicator consists of three key components:
Center Line (PCCI): Represents the average price movement and serves as a reference point for the bands.
Upper Band: Plotted above the center line to indicate potential resistance and overbought conditions.
Lower Band: Plotted below the center line to indicate potential support and oversold conditions.
When the price approaches the upper band, the market may be overbought, signaling a potential reversal or exit point. Conversely, when the price approaches the lower band, the market may be oversold, indicating a possible buying opportunity. The widening and narrowing of the bands help traders identify breakouts and periods of low or high volatility.
Key Features of the Jurik PCCI Bands Indicator
Uses PCCI to create dynamic bands for trend analysis
Identifies trend reversals and breakout opportunities
Highlights overbought and oversold conditions
Suitable for all timeframes and currency pairs
Easy to use and install on MT4
Free to download with customizable settings for personal trading strategies
Benefits for Forex Traders
The Jurik PCCI Bands Indicator provides traders with multiple advantages:
Clear trend visualization: Dynamic bands make it easy to identify market direction and potential reversal points.
Breakout detection: Expanding bands indicate high volatility and potential breakout opportunities.
Overbought and oversold alerts: Helps traders avoid entering trades at extreme price levels.
Flexible application: Can be applied across various timeframes and adjusted to fit individual trading styles.
How to Use the Jurik PCCI Bands Indicator
Install the indicator into the MT4 Indicators folder
Restart MetaTrader 4
Attach the indicator to your preferred chart
Observe the center line and bands for trend direction, breakouts, and reversal points
Combine with other indicators for confirmation and optimized trade entry
Best Practices
Enter trades near the lower band in an uptrend and near the upper band in a downtrend
Confirm breakouts with trend indicators or higher timeframe analysis
Avoid trading when bands are extremely narrow to reduce false signals
Apply proper risk management and position sizing
The Jurik PCCI Bands Indicator is an invaluable tool for Forex traders seeking to identify trend reversals, breakout points, and overbought/oversold conditions. Its clear visual representation and customizable features make it a must-have for any serious MT4 trader. Visit IndicatorForest.com to download this free indicator and explore a wide range of tools to enhance your Forex trading strategy.
Image Suggestions:
FAQ
5 Downloads
Published:
Dec 20, 2025 06:33 AM
Category: