Master Price Action with Candlestick CPI Arrows
In the high-velocity world of financial trading, the ability to identify trend reversals before they fully materialize is the ultimate competitive advantage. While many traders clutter their charts with lagging oscillators, professional Price Action traders look for specific exhaustion and rejection patterns. The Candlestick CPI Arrows indicator is a precision-engineered tool designed to automate the detection of these critical turning points, providing clear visual triggers for high-probability entries.
The Logic of Candlestick CPI
The "CPI" in the indicator's name refers to a specialized price action calculation that identifies candles showing a high degree of rejection or momentum shift relative to recent price history. Unlike a standard moving average crossover, this indicator focuses on the anatomy of the individual candle—specifically how it closes in relation to its high and low.
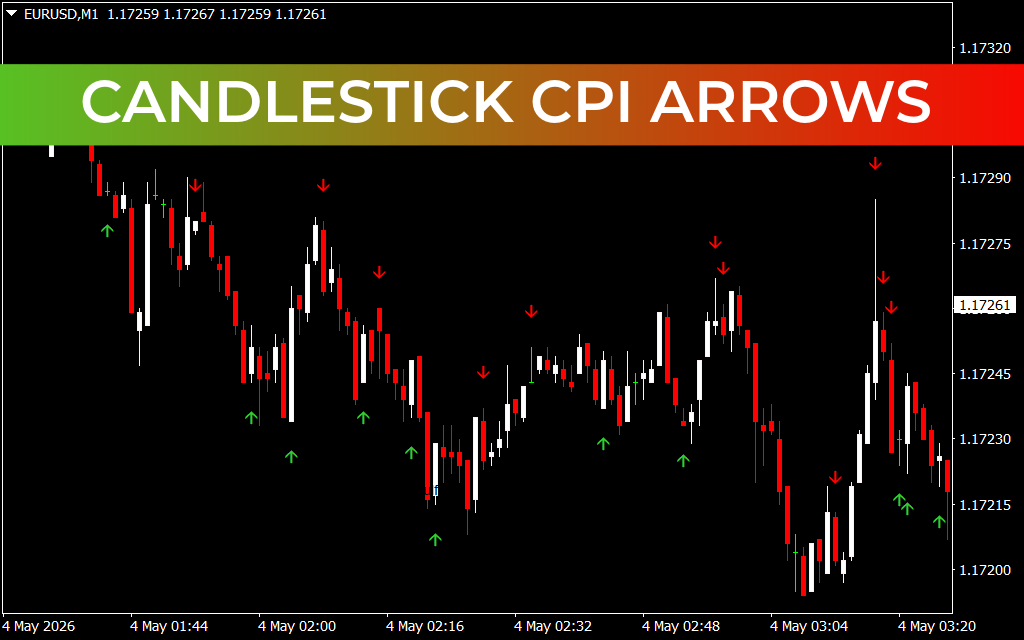
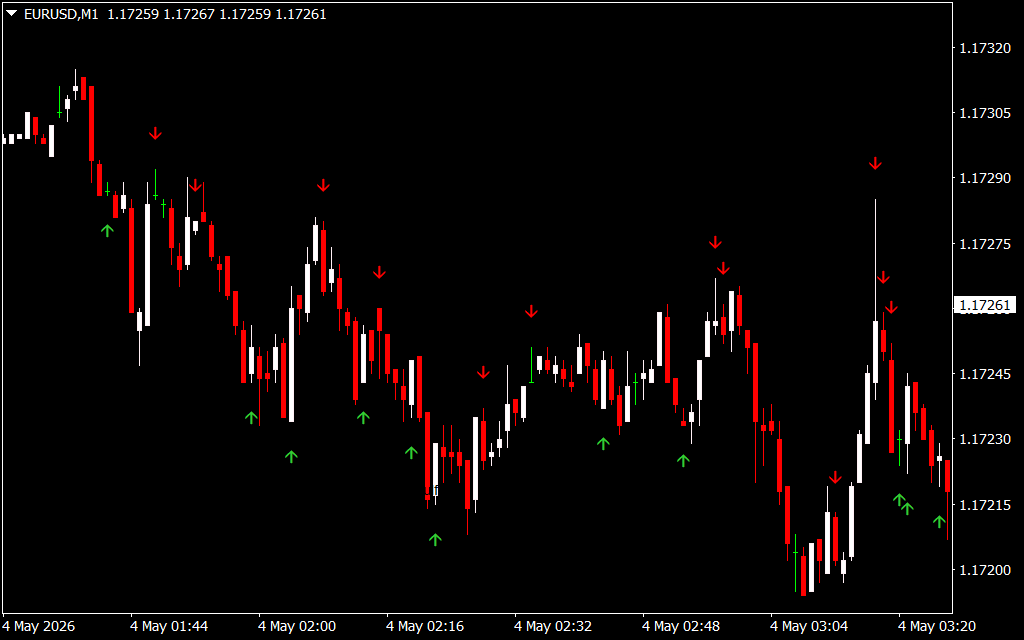
- Green Upward Arrows: These appear at the base of a candle when the indicator identifies a "bullish rejection." This signals that despite selling pressure, buyers have stepped in aggressively, creating a high-probability floor for a new upward move.
- Red Downward Arrows: These are plotted above candles showing "bearish exhaustion." They signal that buying pressure has failed at a peak and that the path of least resistance is now to the downside.
Precision Scalping on the M1 Chart
As demonstrated in the EURUSD M1 chart, the Candlestick CPI Arrows act as a vital filter in volatile, lower-timeframe environments. On a 1-minute chart, it is incredibly easy to be misled by "noise" or minor pullbacks. This indicator helps you stay disciplined by only firing a signal when a statistically significant rejection pattern occurs.
Notice how the arrows often appear at the extreme "wick" ends of the price action. For a scalper, this precision is invaluable for tight stop-loss placement. By entering exactly where the arrow indicates, you can place your risk just a few pips away at the swing high or low, ensuring a highly favorable risk-to-reward ratio. It essentially functions as an automated "pin bar" or "engulfing" pattern detector, removing the human error and subjectivity involved in manual pattern recognition.
Strategic Implementation and Confluence
To achieve long-term consistency, the Candlestick CPI Arrows should be used as an entry trigger within a structured trading plan:
- Trend Alignment: In a strong downtrend, prioritize the red arrows. Using the indicator as a "pullback" trigger during a larger trend is one of the most reliable ways to trade.
- Support And Resistance: The signals gain significant power when they appear at key horizontal levels. A green arrow appearing exactly at a major support zone is a high-confluence signal that professional traders look for.
- Exit Strategy: Beyond entries, these arrows serve as excellent trailing stop indicators. If you are in a long position and a red arrow appears against you, it is often a signal to lock in profits or move your stop to break even.
By automating the identification of complex price action patterns, the Candlestick CPI Arrows empower you to trade with the speed and objectivity of a professional. Stop guessing where the market will turn and start trading with data-driven precision.
1 Download
Last Update:
May 04, 2026 10:35 AM
Published:
Jan 28, 2026 17:10 PM
Category: