Trade with Precision Using the Pivot Two Dots Indicator
In the highly competitive financial markets, trading without a clear view of institutional Support And Resistance is a major risk. While many retail traders crowd their charts with subjective, hand-drawn lines, professional floor traders and market makers rely on mechanical price thresholds: Pivot Points. These math-driven levels act as structural roadmaps for the trading session, showing exactly where big money is likely to enter or exit positions.
The Pivot Two Dots indicator for modern charting platforms automates this structural analysis. By mapping out daily, weekly, or monthly pivot targets instantly, it gives day traders and scalpers an objective view of market geography without cluttering the screen.
Download Pivot Two Dots for free. Automate your support and resistance mapping and capture precise institutional turning points with this elite tool.
What is the Pivot Two Dots Indicator?
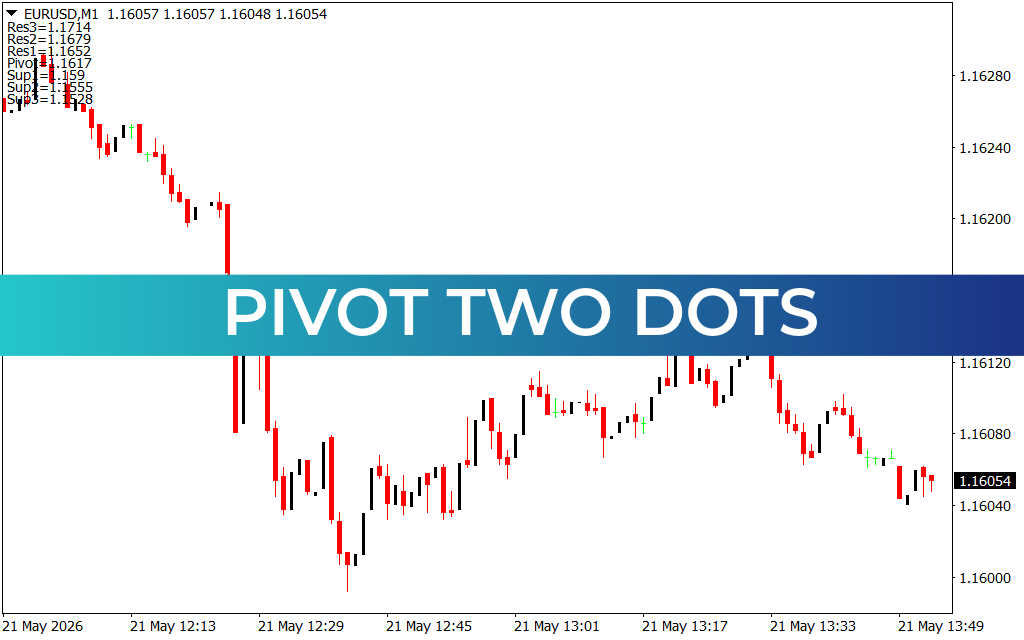
The Pivot Two Dots indicator is a premium technical tool designed to calculate and display essential floor pivot levels on your asset charts. Derived from the high, low, and closing prices of the preceding session, these lines represent pure mathematical equilibrium.
What makes this indicator unique is its clean execution interface. Instead of rendering jagged lines or giant text blocks across your candlesticks, the algorithm uses a minimized data array (such as the text matrix displayed on the chart layout) alongside precise visual anchors. It calculates the central Pivot point, three distinct Resistance bands (Res1, Res2, Res3), and three distinct Support bands (Sup1, Sup2, Sup3). This setup lets you identify major market thresholds in real time while keeping your Price Action perfectly visible.
Key Features and Strategic Advantages
- Automated Institutional Mapping: Instantly eliminates the manual labor of calculating floor pivots, giving you accurate key levels the exact moment a new session opens.
- Streamlined Chart Layout: Replaces messy, overlapping horizontal lines with clear, left-aligned statistical metrics for high-speed visual scanning.
- High-Precision Reaction Bands: Tracks full daily extension targets up to Support 3 and Resistance 3, ensuring you stay protected during highly volatile market conditions.
- Multi-Timeframe Efficiency: Optimized to deliver structural predictive clarity across diverse intervals, from ultra-fast Scalping on the M1 chart to tracking macro cycles on higher timeframes.
How to Trade with Pivot Two Dots
This indicator serves as a robust mechanical filter, helping you execute low-risk setups across different market phases:
1. Establishing the Daily Bias
The central Pivot level serves as the market’s emotional anchor. If price action trades sustainably above the central pivot coordinate, the immediate intraday bias is bullish, and you should focus on buy setups. If price drops below the pivot, the session bias shifts to bearish.
2. Statistical Target Projections
Don't guess where an asset will run out of gas. When buying a bullish breakout, use Res1 and Res2 as your objective, math-based take-profit targets. These levels represent statistical distribution zones where institutional liquidity providers frequently take profits and reverse their exposure.
3. Counter-Trend Mean Reversion
During quiet trading sessions, price will frequently balance between Sup1 and Res1. When price stretches to hit an extreme outer boundary like Support 2 or 3, look for candlestick reversal patterns to catch a high-probability bounce back toward the central pivot baseline.
Conclusion
Relying on lagging indicators or subjective trendlines places you at a steep disadvantage against modern trading algorithms. The Pivot Two Dots indicator converts historical session data into an objective, real-time map of institutional Supply And Demand. Download this vital technical tool today to manage your entries, exits, and risk parameters with absolute structural clarity.
1 Download
Last Update:
May 21, 2026 16:55 PM
Published:
Jan 17, 2026 19:38 PM
Category: