Master Market Reversals with the CCI Divergence Indicator
In the fast-paced world of trading, identifying the exact moment a trend loses momentum is the "Holy Grail" for many investors. While many technical indicators lag behind the price, the CCI Divergence Indicator stands out as a powerful tool for spotting high-probability reversal setups before they happen. Whether you are a forex scalper or a long-term stock trader, understanding how to use CCI divergence can significantly sharpen your market entries.
What is the CCI Divergence Indicator?
The Commodity Channel Index (CCI), originally developed by Donald Lambert, measures the current price level relative to an average price level over a given period. While its standard use is to identify overbought ($+100$) or oversold ($-100$) conditions, its most potent application lies in divergence.
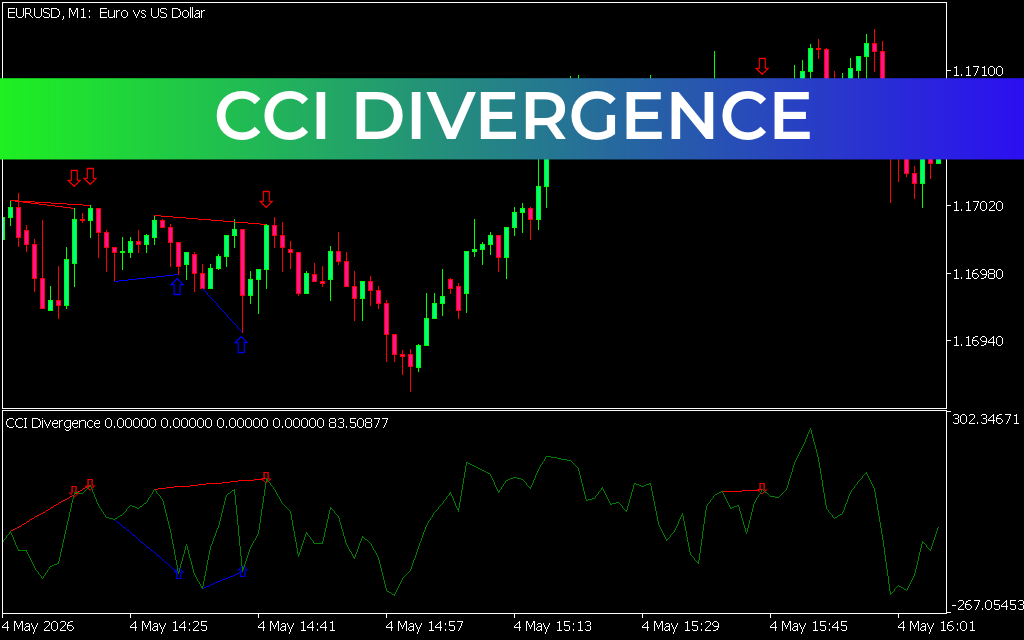
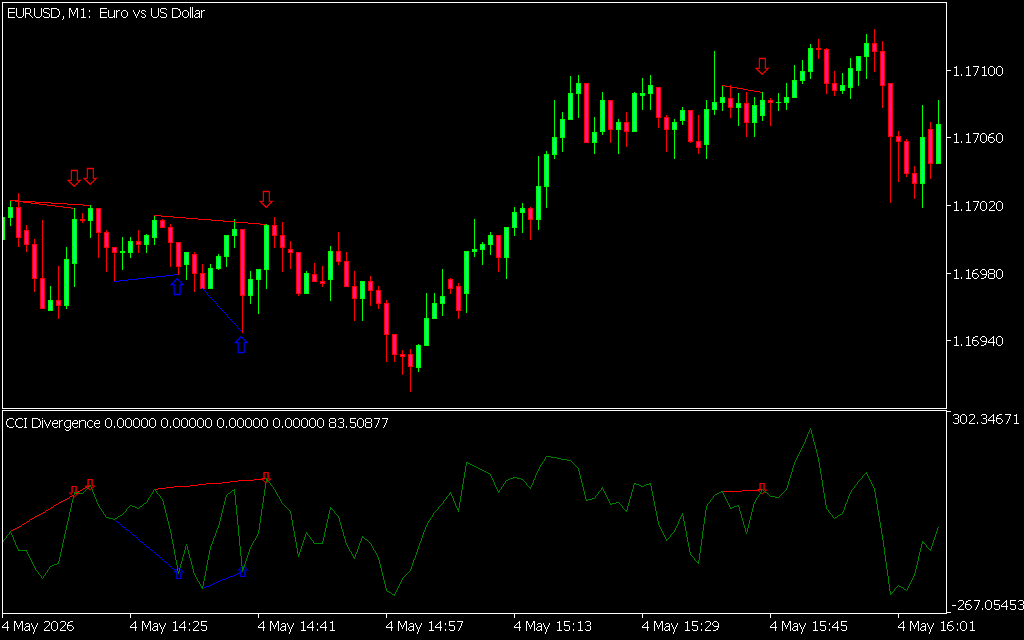
Divergence occurs when the Price Action moves in the opposite direction of the CCI oscillator. This "disagreement" between price and momentum suggests that the current trend is weakening and a reversal is imminent.
Types of CCI Divergence
To trade effectively with this tool, you must recognize the two primary forms of divergence:
- Bullish Divergence: This occurs when the price makes a "Lower Low," but the CCI forms a "Higher Low." It indicates that despite the price drop, selling pressure is fading, signaling a potential upward move.
- Bearish Divergence: This happens when the price records a "Higher High," but the CCI produces a "Lower High." This suggests buying momentum is exhausting, and a price drop may be around the corner.
Why Use a Custom CCI Divergence Indicator?
Manually scanning multiple charts for hidden divergence can be exhausting and prone to human error. A dedicated CCI Divergence Indicator for platforms like MetaTrader 4 (MT4) or MT5 automates this process. These tools typically offer:
- Real-Time Alerts: Get notified via sound or email the moment a divergence is detected.
- Visual Markings: Lines are automatically drawn on the chart to connect the highs and lows, making the setup impossible to miss.
- Customization: Adjust the CCI period (commonly 14 or 20) to suit your specific trading style.
Trading Strategy: Adding Confluence
While CCI divergence is powerful, it is best used in conjunction with other technical analysis tools. For the best results, look for divergence occurring at:
- Major Support And Resistance levels.
- Psychological round numbers.
- Fibonacci retracement zones.
By waiting for the CCI to cross back into the neutral zone (the $-100$ to $+100$ range) after a divergence appears, you add an extra layer of confirmation to your trade.
3 Downloads
Last Update:
May 05, 2026 15:14 PM
Published:
Jan 27, 2026 21:07 PM
Category: