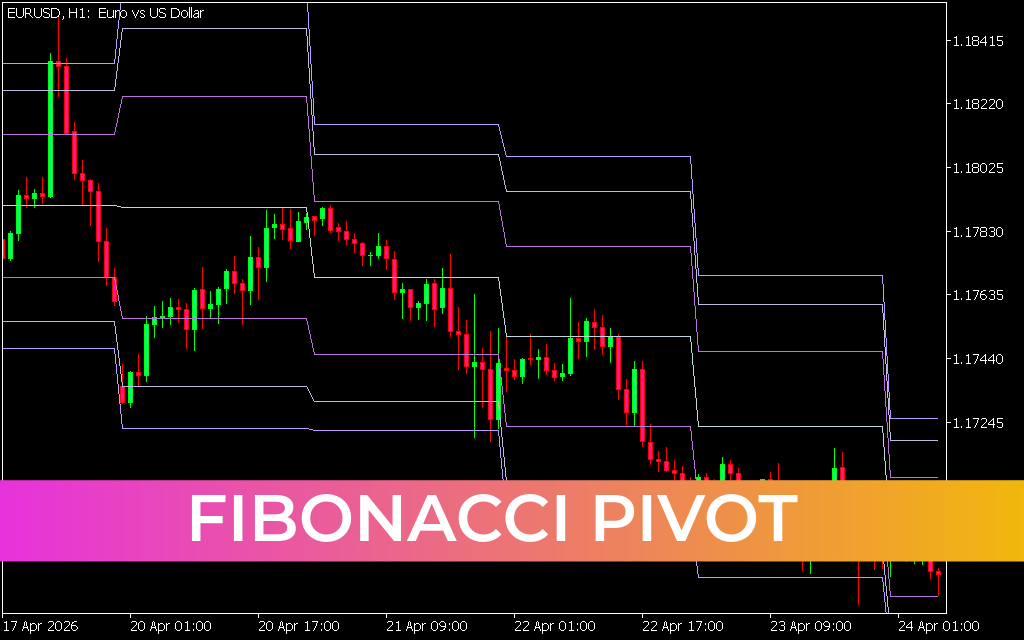
Elevate Your Trading Precision with the Fibonacci Pivot Indicator
In the world of professional technical analysis, identifying where price will stall, reverse, or breakout is the key to consistent profitability. The Fibonacci Pivot indicator is a sophisticated trading tool that combines two of the most powerful concepts in market geometry: standard Pivot Points and Fibonacci retracement levels. By merging these methodologies, the indicator creates a predictive roadmap of high-probability Support And Resistance zones that retail and institutional traders alike watch closely.
The Science Behind Fibonacci Pivots
Standard pivot points are calculated using the previous day's high, low, and close. While effective, they often miss the subtle "golden" ratios that govern natural price movements. The Fibonacci Pivot indicator addresses this by using Fibonacci multiples—primarily 38.2%, 61.8%, and 100%—to determine the distance of the support (S) and resistance (R) levels from the central pivot point.
This mathematical approach aligns your charts with the natural ebb and flow of the markets. Because so many algorithmic trading systems and professional desk traders use these exact levels, they often become self-fulfilling prophecies, leading to significant price reactions exactly at the plotted lines.
Key Features and Strategic Advantages
- Automated Level Mapping: No more manual calculations or drawing tools. The indicator automatically plots the central pivot and all associated S/R levels as soon as a new trading session begins.
- Predictive Support and Resistance: Unlike lagging indicators, Fibonacci Pivots are "leading." They tell you where price is likely to react before it gets there.
- Confluence Discovery: When a Fibonacci Pivot level aligns with a moving average or a historical horizontal level, it creates a "Confluence Zone," representing an exceptionally high-probability trade entry point.
- Adaptability: This tool is equally effective for scalpers on the 5-minute chart looking for quick intraday targets and for swing traders on the daily timeframe managing long-term positions.
How to Trade Using Fibonacci Pivots
The most common strategy involves watching for price exhaustion at the outer edges of the pivot range. For instance, if the market is trending upward and hits the R3 (Resistance 3) level, it is statistically overextended. A bearish candlestick pattern at this level often signals a perfect short opportunity.
Conversely, in a trending market, a "breakout and retest" of the central pivot point can confirm that the trend has legs. Many traders use the levels as definitive take-profit targets, exiting their positions as the price touches the 61.8% or 100% Fibonacci extensions.
Conclusion
The Fibonacci Pivot indicator is an essential asset for any trader looking to move beyond basic price action. By providing a clear, objective framework for Market Structure, it removes the emotional guesswork and replaces it with mathematical certainty. Whether you are trading Forex, stocks, or commodities, integrating Fibonacci Pivots into your workflow will provide the structural clarity needed to take your trading to the next level.
7 Downloads
Last Update:
May 06, 2026 01:41 AM
Published:
Jan 27, 2026 13:07 PM
Category: