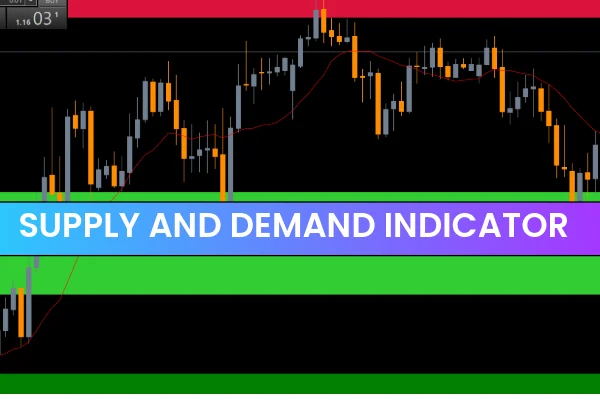
The Supply And Demand Indicator for MT5 is one of the most essential tools for forex traders who rely on Price Action, institutional levels, and smart money concepts. Supply and demand zones form the foundation of market movement, and price continues to respect these zones for months or even years after they appear. With this indicator, traders no longer need to manually draw every historical zone—everything is generated automatically with precision.
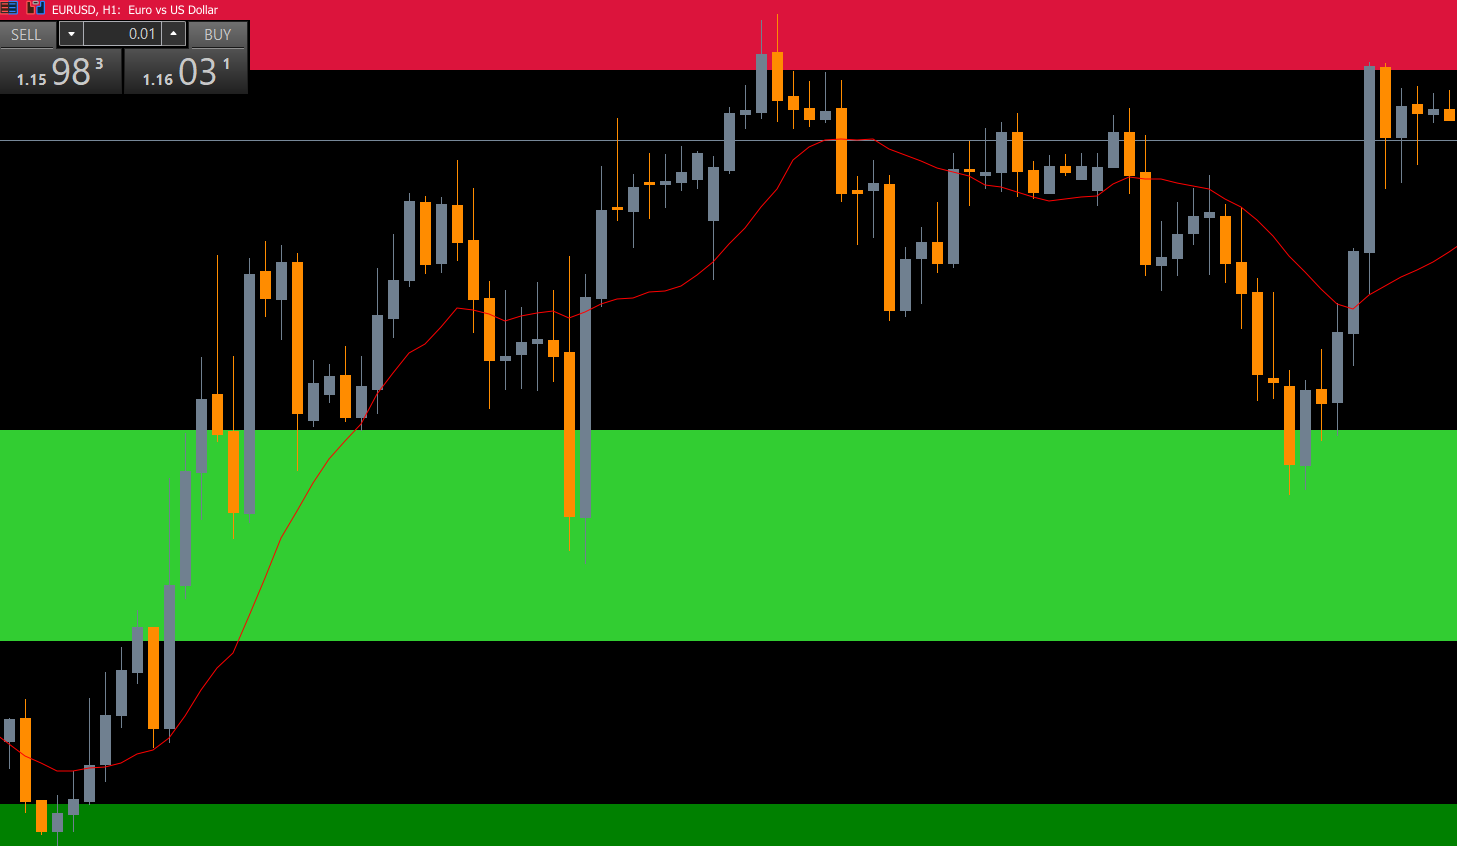
The indicator accurately detects validated supply (sell) zones and demand (buy) zones directly on the chart. It highlights fresh and retested areas, grayed-out inactive zones, and even offers optional Fibonacci retracement overlays for deeper confluence analysis. Whether you're a beginner or a professional, this indicator simplifies zone trading and enhances clarity across all market conditions.
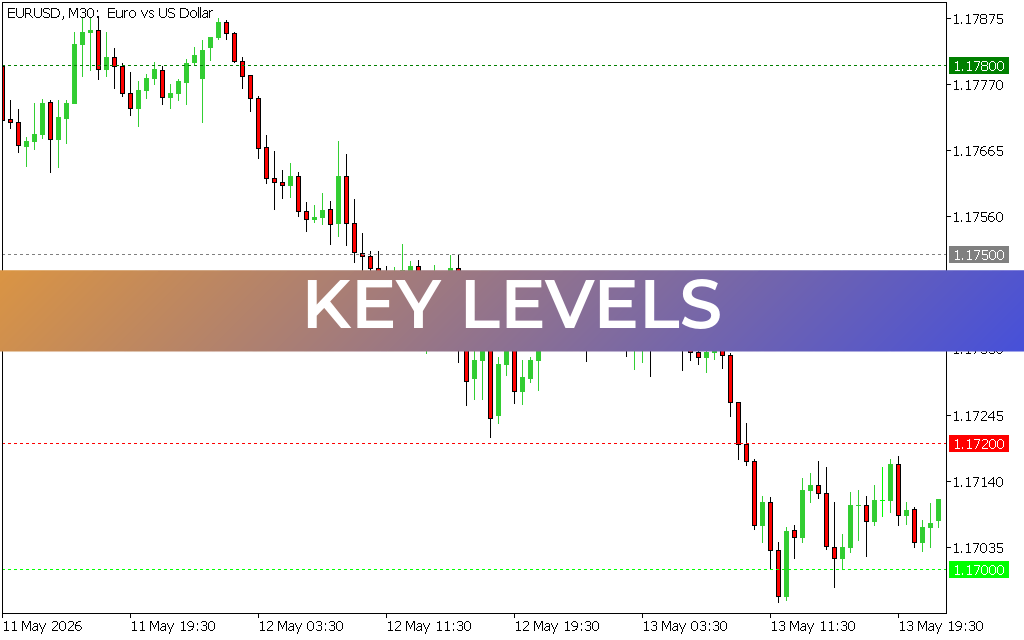
Understanding Supply and Demand Zones
Supply and demand zones represent price areas where institutional orders were placed in large volumes. When price returns to these zones, the market often reacts strongly:
Supply zone: A region where sellers previously dominated. Price tends to drop when revisiting this area.
Demand zone: A region where buyers controlled the market. Price often rises from this level.
Because these levels reflect real market psychology and institutional flows, they remain valid for extended periods.
Features of the Supply and Demand Indicator for MT5
The Supply and Demand Indicator for MT5 offers several advantages for traders:
Automated Detection
The indicator scans price action and automatically draws key supply and demand zones without the trader lifting a finger.
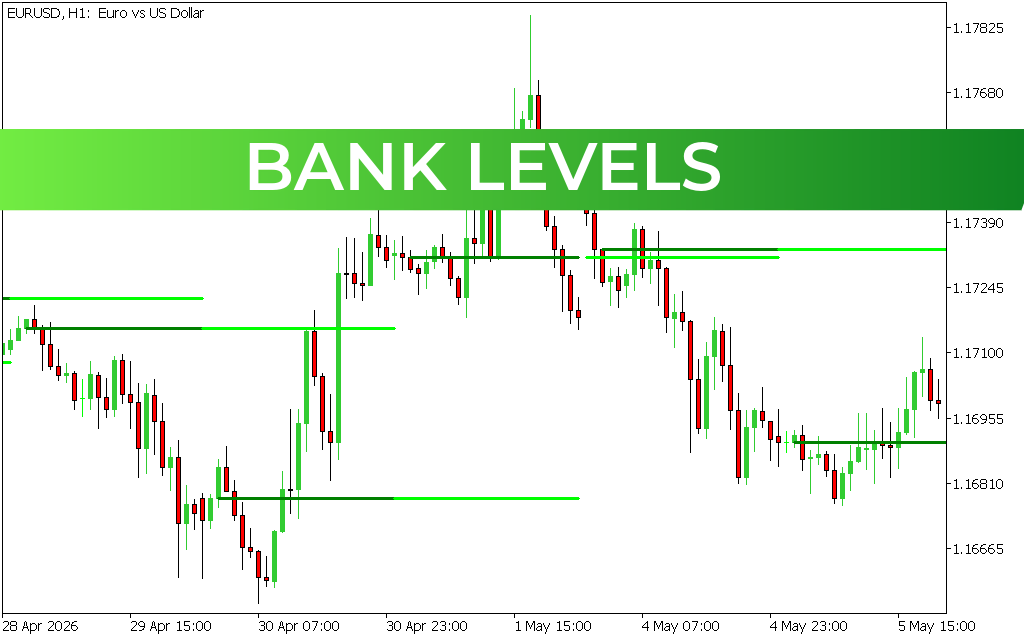
Tested and Untested Zones
Green and red zones: Tested multiple times, high-probability areas.
Sea-green and orchid zones: Untested or developing areas, useful for planning potential setups.
Multi-Timeframe Accuracy
The indicator supports all timeframes—Scalping, intraday, swing, and position trading.
Fibonacci Integration
A built-in option allows traders to display Fibonacci retracement between zones to add another layer of confirmation.
Clean and Intuitive Visualization
Zones are color-coded and visually distinct, making chart reading more efficient and beginner-friendly.
How to Use the Supply and Demand Indicator for MT5
Using the Supply and Demand Indicator is simple due to its alignment with Support And Resistance trading principles.
Trade Using Zone Reactions
Price frequently bounces from supply or demand areas:
Sell when price enters a supply zone.
Buy when price enters a demand zone.
These reactions happen because institutional orders are usually placed at these levels, causing strong market responses.
Focus on Tested Zones
Tested zones (green and red) offer the highest accuracy because they have proven their strength by rejecting price multiple times.
Look for Clear Market Structure
Combine the indicator with basic Market Structure concepts—higher highs, lower lows, liquidity sweeps—to improve entry precision.
Enhance Accuracy With Confluence
The indicator becomes even more powerful when paired with:
Fibonacci retracement
Breaker blocks
Trendlines
Smart money concepts
Momentum indicators
This layered approach allows traders to form a professional trading plan.
Who Should Use the Supply and Demand Indicator?
The Supply and Demand Indicator for MT5 is beneficial for:
Beginners
New traders who struggle to draw clean and accurate zones will appreciate the automated mapping.
Intermediate Traders
Those familiar with support and resistance will gain speed and accuracy in their analysis.
Advanced Traders
Even professional traders who draw custom zones can use this indicator as a confirmation tool because of its consistency and precision.
Final Thoughts
The Supply and Demand Indicator for MT5 is one of the most powerful tools for identifying high-probability trading zones. Whether you trade reversals, trend continuation, break-and-retest setups, or institutional smart money concepts, this tool helps pinpoint reliable entry and exit areas.
To download more premium and free MT4/MT5 indicators, visit IndicatorForest.com and explore the complete collection.
FAQ
53 Downloads
Published:
Nov 30, 2025 08:45 AM
Category: