Map Structural Market Shifts with the FRZ Auto Channel Indicator
In the highly competitive world of retail forex trading, fighting against the dominant market trend is a primary cause of account liquidation. A currency pair may look like it is ready to reverse, prompting eager day traders to catch the absolute bottom or top, only for the price to continue expanding along its institutional path. To trade with a sustainable edge, market participants must accurately identify the boundaries of the current trend. The FRZ Auto Channel indicator for MetaTrader offers a fully automated technical solution, plotting precise linear regression channels right onto your primary trading workspace.
The Mathematics behind Automated Channel Geometry
The FRZ Auto Channel engine functions as an intelligent, real-time geometric overlay that removes human emotion and subjectivity from trendline analysis. Rather than forcing you to manually connect random swing highs and swing lows—which can vary drastically from one trader to another—the underlying algorithm scans historical candle distribution and volatility metrics over a designated lookback window to calculate an objective mathematical channel.
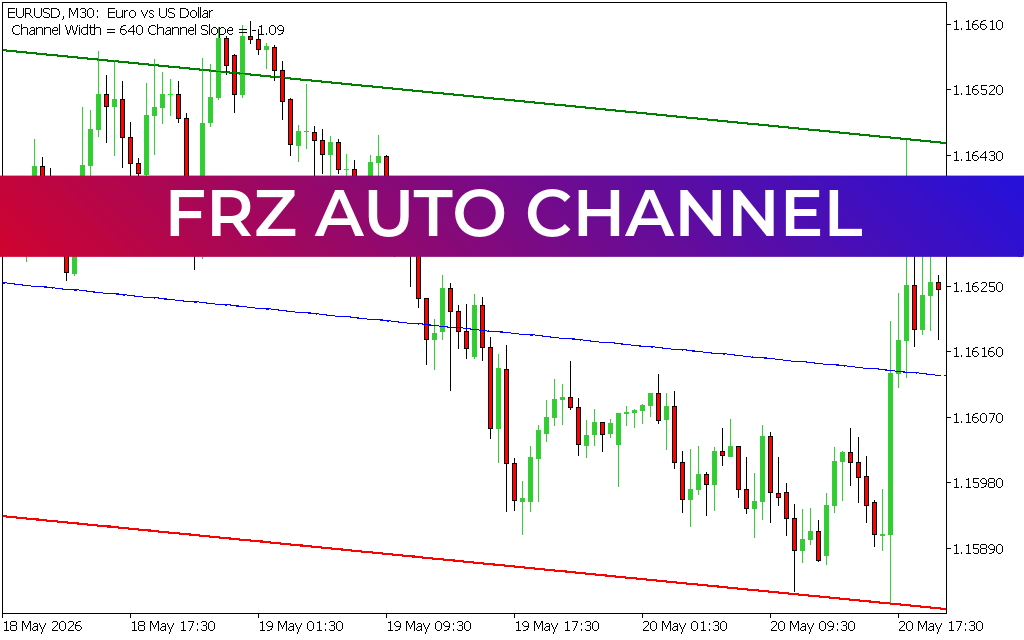
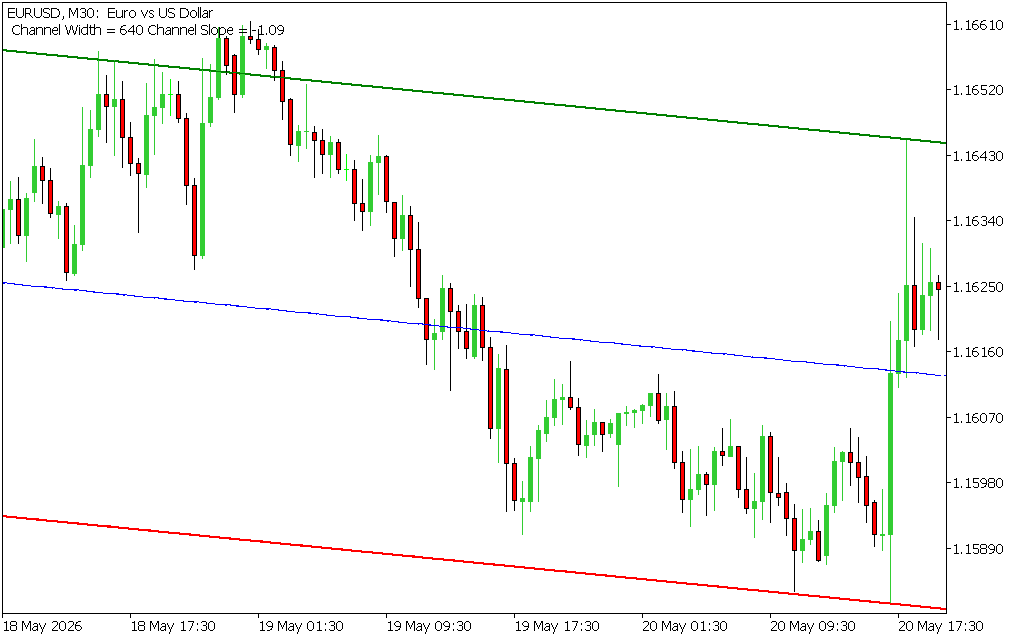
As displayed on the EURUSD 30-minute workspace, the indicator establishes a clear three-line geometric corridor:
- The Upper Volatility Boundary (Green Line): This represents the statistical ceiling of the current trend. It serves as a visual guide for identifying overbought conditions within a markdown or markup phase, flagging optimal zones to lock in profits or look for short-term mean-reversion setups.
- The Structural Equilibrium Axis (Blue Line): Running directly through the center of the channel, this baseline serves as the ultimate fair-value line. Price Action naturally cycles around this axis during standard accumulation and distribution loops.
- The Lower Volatility Boundary (Red Line): This serves as the absolute floor of the active trend corridor. When price action interacts with this line during a structured markdown phase, it highlights deep value and institutional buying pools.
Key Trading Features and Core Strategic Benefits
- Dynamic Automated Plotting: Automatically adjusts its angle, width, and slope metrics as fresh price data prints, saving you hours of manual charting.
- Instant Volatility Metrics: The dashboard prints a real-time header showing the exact channel width in points and the current slope direction, giving you immediate context on market velocity.
- Excellent Workspace Hygiene: The clean, ultra-thin line matrix maps seamlessly over standard Japanese candlesticks, ensuring your chart stays clear for secondary confirmations.
- Optimized for Multi-Session Swing Trading: Delivers exceptional structural feedback on M30 layouts, helping you navigate cross-session moves between London and New York.
Disciplined Position Management Using FRZ Auto Channel
To transform this automated graphing engine into a profitable mechanical strategy, apply a structured execution framework to your daily workflow:
- The Trend Channel Pullback Setup: In a downward-sloping channel (indicated by a negative slope value), wait for price to rally up and test the green upper regression line. Look for a bearish engulfing or pin-bar candlestick to validate institutional rejection before executing a short position.
- The Structural Equilibrium Bounce: During strong trending environments, the central blue axis acts as dynamic support or resistance. A clean bounce off this central vector confirms that the trend has high velocity, allowing you to scale into winning positions.
- Calibrated Capital Protection: When taking a trade at the outer bands, place your protective stop-loss slightly beyond the green or red line. This keeps your downside risk strictly defined while you target a full rotation back to the opposite side of the corridor.
9 Downloads
Last Update:
May 22, 2026 20:55 PM
Published:
Jan 17, 2026 14:23 PM
Category: