Mastering Volatility Channels: Trading Breakouts and Reversals with the Starc Band Indicator
In high-frequency financial markets, navigating the delicate balance between price expansion and sudden mean reversion is the ultimate challenge for day traders and scalpers. Traditional volatility bands often rely purely on standard deviations, which can leave retail traders blind to the underlying true range of recent Price Action. The Starc Band Indicator (Stoller Average Range Channels) solves this limitation by incorporating an advanced pricing matrix that pairs a central Simple Moving Average (SMA) with dynamic outer bands calculated using the Average True Range (ATR). This creates a highly responsive, structural channel that adapts flawlessly to shifting volatility states.
Analyzing Channel Geometry on the EUR/USD M1 Chart
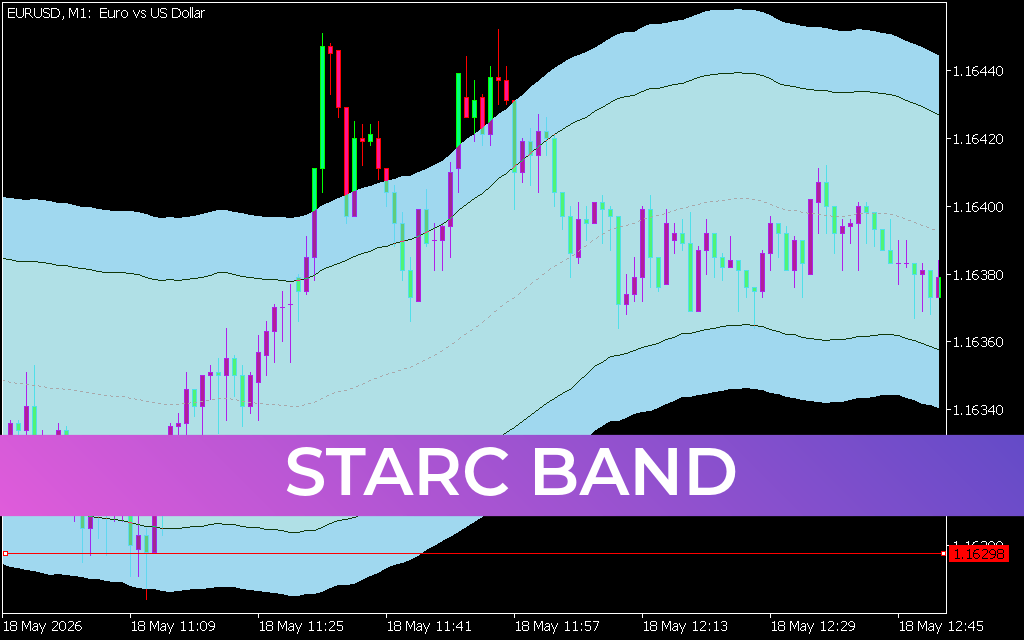
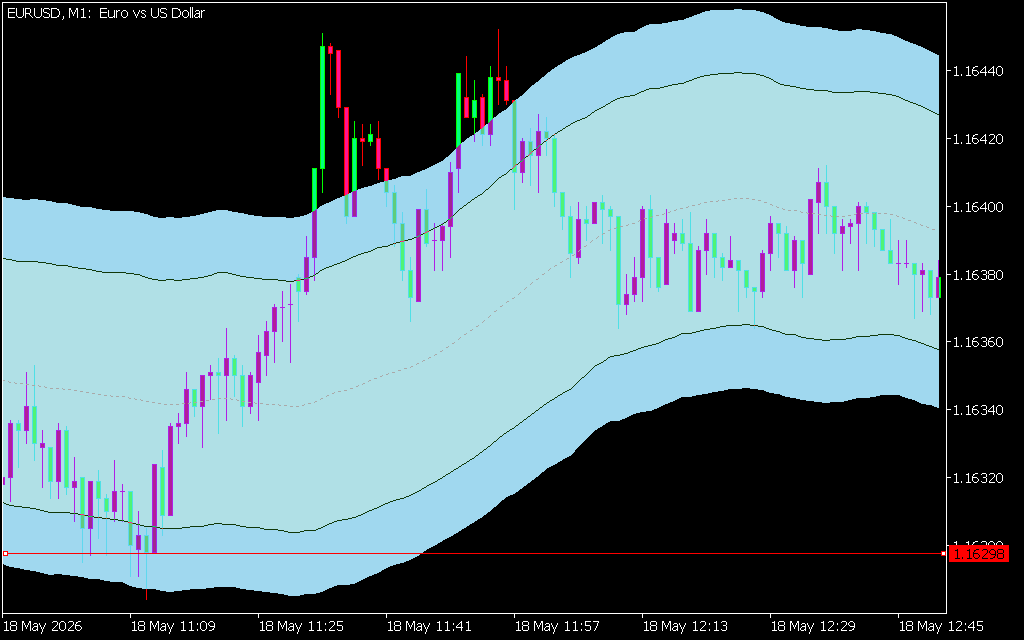
The uploaded EUR/USD 1-minute (M1) chart beautifully showcases how the Starc Band framework maps institutional order flow during short-term intra-day cycles. Operating directly on the price field, the indicator visualizes the market by establishing three critical zones: a central dashed median line, two intermediate thin black boundaries, and two thick black outer bands creating a shaded light-blue volatility envelope.
During the early stages of the May 18 session, the currency pair initiated a steady markup phase, climbing away from its local accumulation floor near 1.16300. Notice how the Starc Band engine expands dynamically as volume injections hit the workspace. For high-frequency momentum scalpers, the intermediate lines and the shaded blue channel offer clear technical boundaries.
As long as the bullish candles ride along the upper intermediate line or expand into the upper shaded zone, the immediate buying pressure is highly robust. This structure allows trend followers to confidently trail their stop-losses safely beneath the central dashed moving average line.
Trading Volatility Climaxes and Structural Rotations
The true tactical value of the Starc Band indicator unfolds when price action reaches extreme volatility thresholds, highlighting high-probability exhaustion points and trend rotations.
Following a vertical expansion, the EUR/USD pair peaked aggressively past the 1.16440 level. At this exact juncture, the candlesticks penetrated completely through the uppermost solid black boundary. In technical analysis, a sustained push outside the extreme Starc Band limits signals an overextended market state where the price is statistically prone to mean reversion.
True to its formula, the asset stalled at this volatility climax and entered a distribution phase. The Market Structure rotated sharply as sellers stepped in, forcing the price back beneath the central median line and driving a swift markdown leg toward the 1.16370 liquidity pool. Currently trading near 1.16380, the price is stabilizing within the lower half of the channel, demonstrating how the bands act as elastic horizontal boundaries.
By integrating the Starc Band indicator into your MT4 or MT5 workspace, you remove the guesswork from range analysis. It arms you with an objective mathematical grid to avoid buying at the absolute top of a market cycle, enter high-confluence breakouts at the birth of an expansion wave, and manage your risk with complete precision.
Meta Description:
4 Downloads
Last Update:
May 18, 2026 16:45 PM
Published:
Jan 19, 2026 21:45 PM
Category: