Master Trend Geometry: Ultimate Guide to the SHI Channel Indicator
Navigating the financial markets requires a clear understanding of Market Structure and trend direction. While drawing manual trendlines is a foundational skill for technical analysts, it introduces human subjectivity and can be highly time-consuming when tracking multiple timeframes.
The SHI Channel Indicator eliminates this friction. By automating the extraction of dynamic trend channels based on real-time price geometry, this automated tool equips traders with immediate visual boundaries for any asset class.
What is the SHI Channel Indicator?
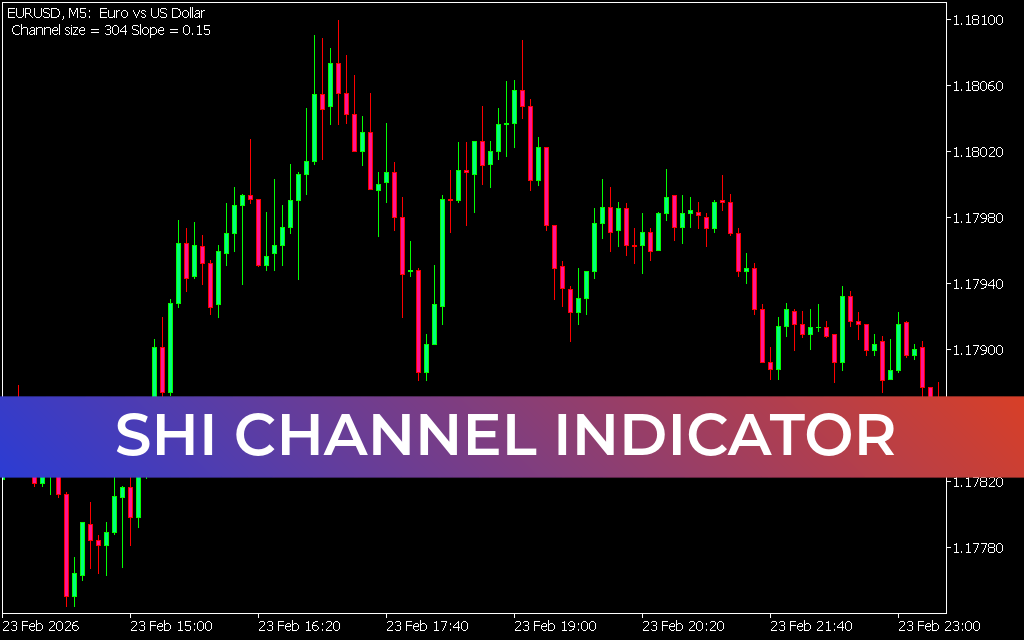
The SHI Channel Indicator is a highly responsive technical software that automatically plots Barishpolts dynamic moving channels on your trading platform. It functions using algorithmically calculated swing highs and swing lows (fractals).
The underlying program scans the recent Price Action to locate the most relevant historical fractals, draws a core trendline between them, and projects a perfectly parallel boundary line along the maximum structural extreme on the opposite side. Finally, it constructs a midline (median) to represent the equilibrium point of the currency pair.
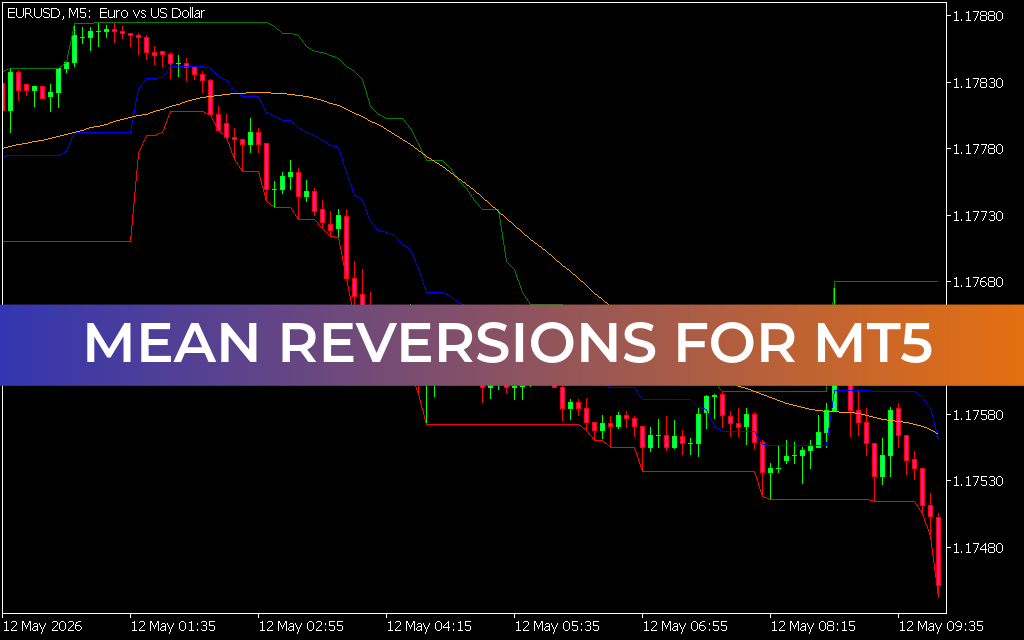
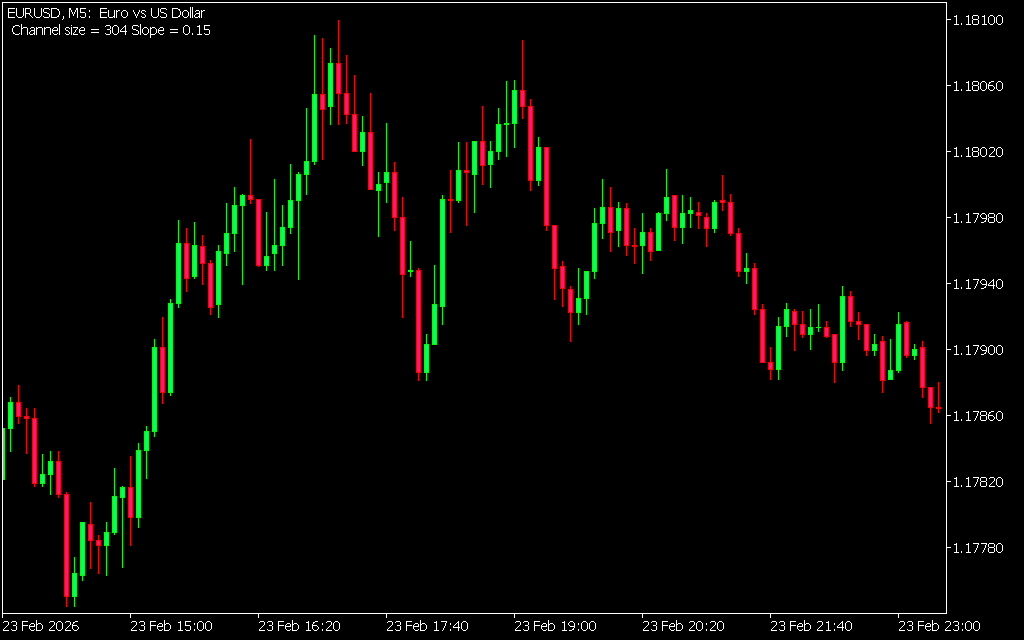
As displayed in the EUR/USD 5-minute (M5) chart above, the system outputs immediate geometric parameters in the upper-left corner—such as the exact Channel size (e.g., 304 points) and the exact Slope orientation (e.g., 0.15). This provides a mathematical context to the current volatility and market direction.
Key Features and Strategic Advantages
- Subjectivity-Free Analysis: Algorithmic calculation ensures that your channels are always drawn using accurate, un-biased structural mathematical pivot points.
- Real-Time Dynamic Recalculation: As the asset registers new market highs or lows, the channel seamlessly morphs to accommodate the evolving trend.
- Instant Volatility Metrics: Live text data displayed natively on the chart keeps you informed of the channel's width and inclination.
- Multi-Timeframe Compatibility: Highly effective across all time horizons, from high-velocity M5 intraday environments to structural daily execution setups.
How to Trade with the SHI Channel Indicator
Integrating an automated channel framework into a live trading methodology simplifies execution logic across two main disciplines:
- Trend-Following (Channel Bounces): In an ascending channel (positive slope), traders look to execute long entries when price action retraces toward the lower boundary line. In a descending channel (negative slope), short positions are prioritized near the upper boundary line.
- Breakout Strategies: When price breaks cleanly out of the established upper or lower channel lines with strong institutional momentum, it often signals the birth of a major macroeconomic expansion phase or an aggressive Trend Reversal.
For optimized accuracy, use the mid-line as a scaling or profit-taking target, and combine your channel boundaries with complementary confirmation filters like volume profiles or momentum oscillators.
5 Downloads
Last Update:
May 24, 2026 02:37 AM
Published:
Jan 15, 2026 19:33 PM
Category: