Unlocking Correlation and Intermarket Edge with the Overlay Chart Indicator
In modern financial markets, assets do not move in absolute isolation. Global capital flows continuously link different currency pairs, commodities, and equity indices through strong statistical relationships known as intermarket correlations. For retail traders, tracking these hidden linkages typically requires multiple monitors or tedious workspace flipping. The Overlay Chart indicator solves this operational bottleneck by allowing MetaTrader users to superimpose a secondary asset's live Price Action directly onto their primary chart window.
The Strategic Power of Intermarket Correlation
To establish a genuine edge in the Forex market, smart money participants rely heavily on relative strength and currency correlations. For example, major pairs like EURUSD, GBPUSD, and AUDUSD frequently move in tandem due to their shared vulnerability to US Dollar volume blocks. Conversely, pairs like EURUSD and USDCHF historically share an intense negative correlation.
The Overlay Chart indicator makes these relationship matrixes instantly visible. By casting a secondary symbol as a clear, real-time overlay on your active workspace, you can unlock key institutional insights:
- Leading and Lagging Divergences: Frequently, one highly correlated pair will break out of a consolidation range several candles ahead of its sister pair. The overlay framework lets you spot this lag immediately, allowing you to catch the secondary asset's breakout execution early.
- Relative Strength Evaluation: When two pairs pull back during a dollar markdown phase, the asset that holds its structure better reveals significant relative strength. This tells you exactly which pair offers the highest probability for a long continuation.
Navigating the Dual-Asset Visual Layout
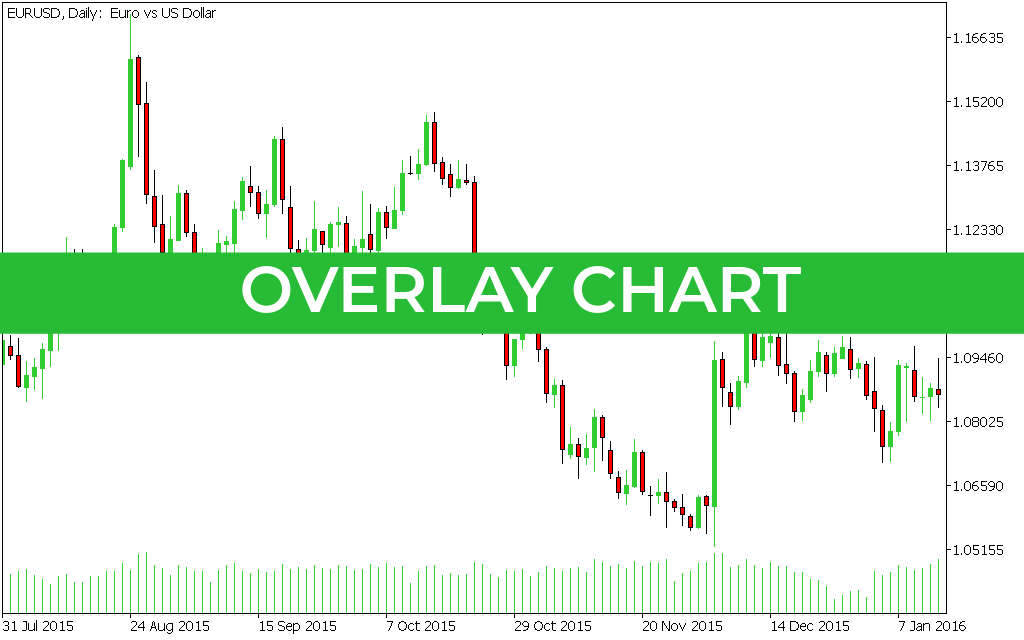
As displayed on the EURUSD 5-minute (M5) chart, the indicator seamlessly manages screen space without cluttering your core price charts. The main asset prints its standard red and white candlesticks, tracking localized price structure.
Meanwhile, the Overlay Chart engine processes live price quotes for a secondary symbol—such as GBPUSD, AUDCAD, or gold—and projects its price path via a clean, specialized indicator overlay. As shown on the right-hand margin, a distinct purple vertical line marks the terminal boundary of the active session, establishing a crisp structural line where historical closing data transitions into live, real-time tick streaming.
This layout allows day traders and scalpers to monitor two distinct instruments at the exact same moment. You can view raw candlestick configurations, tracking order blocks and liquidity pools on your primary pair while simultaneously verifying if the macro intermarket trend supports the setup.
Implementing a Discipline-Driven Overlay Strategy
The Overlay Chart indicator serves as a foundational layer for sophisticated technical systems, matching perfectly with multi-asset scanning strategies. A highly reliable execution methodology involves monitoring major structural support or resistance levels.
When your secondary pair sweeps a major liquidity pool and reverses sharply, it acts as an early warning mechanism that the primary pair is about to follow suit. By taking the emotional guesswork out of intermarket tracking, this optimized tool allows you to execute high-confluence setups with absolute mathematical consistency and disciplined risk management.
7 Downloads
Last Update:
May 24, 2026 02:20 AM
Published:
Jan 15, 2026 19:49 PM
Category: