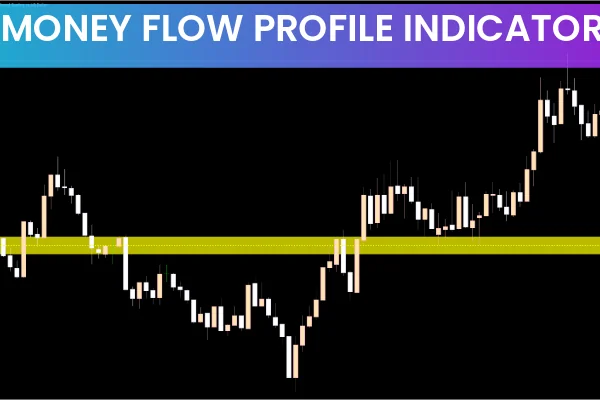
The Money Flow Profile Indicator for MT5 by LuxAlgo is an advanced analytical tool that shows how money and volume flow within the market at specific price levels. Unlike traditional volume indicators that display only total activity per candle, this indicator reveals where the heaviest transactions occur, helping traders detect critical support, resistance, and Liquidity Zones.
From personal experience, one of the most striking features is its ability to map institutional accumulation and distribution areas with ease. By combining volume clusters, sentiment zones, and node coloration, the indicator provides a detailed view of likely price reaction points, giving traders a unique edge.
How the Indicator Works
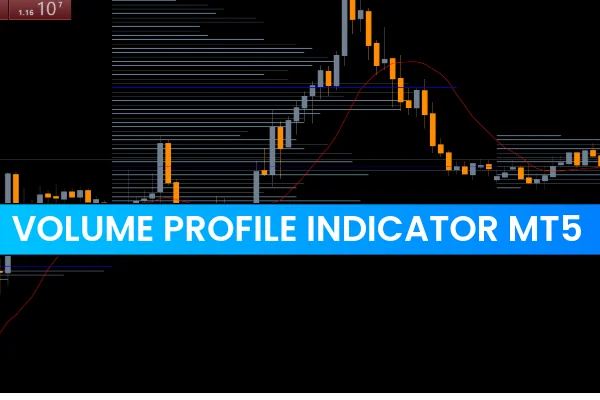
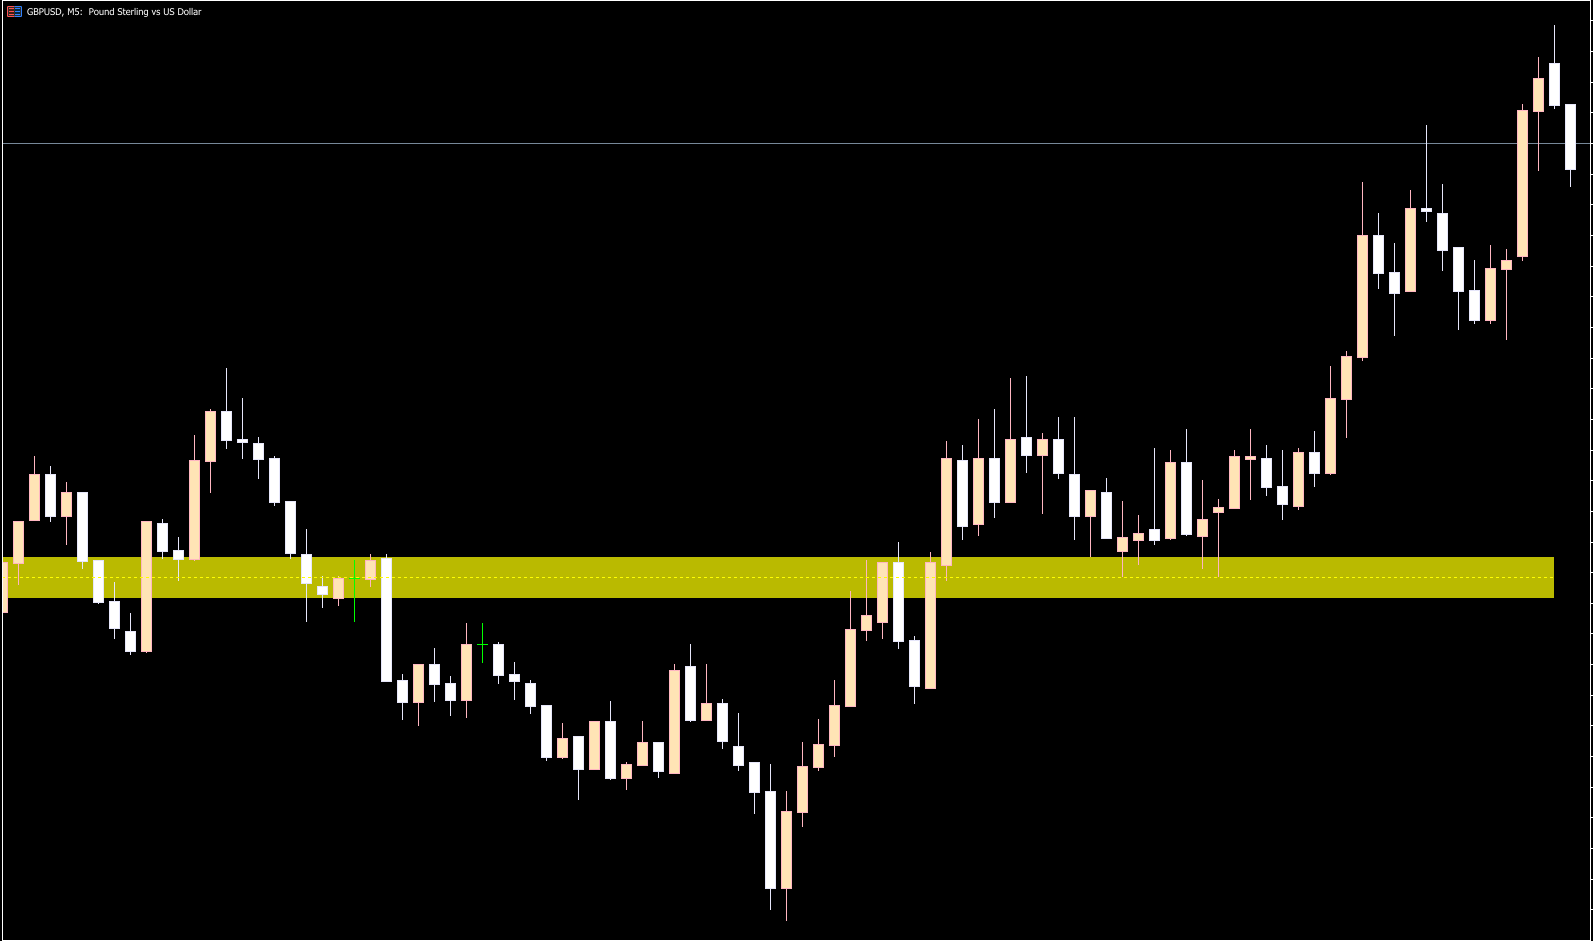
The Money Flow Profile Indicator constructs a horizontal histogram alongside the chart, displaying the distribution of traded volume or money flow over a defined lookback period.
High traded nodes (yellow) indicate heavy institutional interest, often acting as key supply or demand zones.
Low traded nodes (lighter shades) show areas where price can move quickly with minimal resistance.
When price approaches a high traded node, it often slows or reverses due to increased liquidity. Conversely, movement through low-volume zones can lead to sharp breakouts. In my testing, aligning trades with these transitions improved timing and precision significantly.
Sentiment Profile Visualization
LuxAlgo adds another layer of clarity through its sentiment profile, which color-codes nodes:
Teal zones indicate dominant buying pressure (bullish activity).
IndianRed zones show sell-side dominance (bearish activity).
This visual representation confirms momentum and breakout trades, helping traders enter in line with institutional flows and market sentiment.
Practical Trading Applications
The Money Flow Profile Indicator is ideal for both intraday and swing traders. Some common applications include:
Identifying strong accumulation or distribution zones for entries and exits
Confirming breakout strength through transitions between high and low volume nodes
Spotting liquidity zones where price may stall or reverse
Enhancing order flow strategies with volume and sentiment insights
By visualizing where institutional interest clusters, traders can make more informed decisions and reduce reliance on guesswork.
Why Traders Prefer This Indicator
This tool transforms traditional volume analysis into a multi-layered visualization of Market Structure. By highlighting areas of concentrated activity, it reveals hidden liquidity levels and provides context to price movements. For professional traders, it becomes indispensable for:
Technical analysis setups
Momentum and breakout strategies
Volume-based confirmation systems
The dynamic presentation of money flow and sentiment simplifies complex market behavior, giving traders a clear roadmap for action.
Conclusion
The Money Flow Profile Indicator for MT5 by LuxAlgo offers a unique combination of money flow analysis, volume distribution, and sentiment visualization. It helps traders pinpoint key accumulation and distribution zones, spot liquidity shifts, and align trades with institutional flows.
For traders seeking precision, clarity, and actionable insights, this indicator is an essential tool. To explore more professional trading indicators and strategies, visit IndicatorForest.com.
FAQ
14 Downloads
Published:
Dec 03, 2025 00:47 AM
Category: