Unlocking Institutional Price Levels with the Supply and Demand Indicator
Trading successfully in the Forex market requires identifying where major institutional market participants—like banks and hedge funds—are placing their largest orders. Traditional Support And Resistance lines often fail because they treat price levels as exact numbers rather than broader zones.
Download Supply And Demand for free. Automatically map institutional order blocks and trade high-probability reversal zones on your MetaTrader chart.
The Supply and Demand indicator solves this fundamental issue by automatically mapping out heavy institutional order blocks directly onto your trading chart, giving retail traders an institutional edge.
What is the Supply and Demand Indicator?
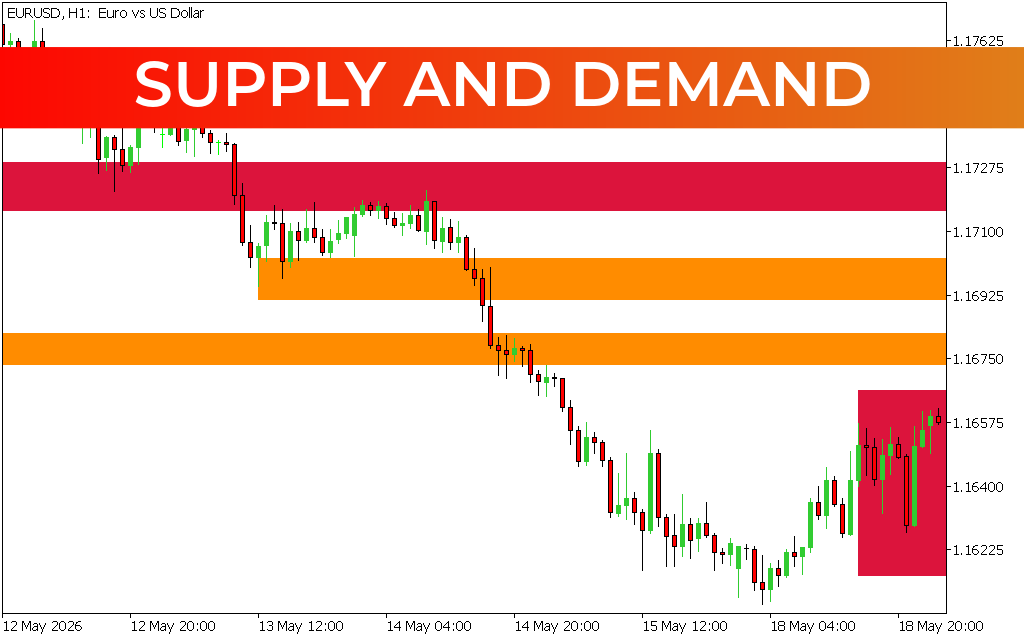
The Supply and Demand indicator is an advanced technical tool that scans historical Price Action to find periods of intense market imbalance. When a massive influx of buying or selling pressure occurs, it leaves behind an unfilled order block. This indicator identifies those exact areas and projects them forward as clear, color-coded horizontal bands.
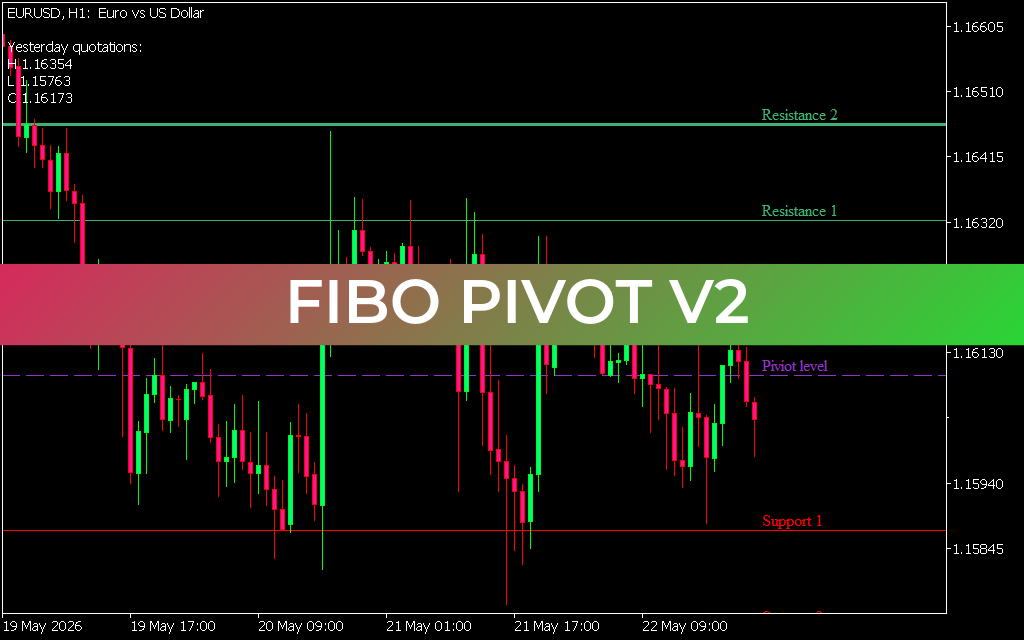
As displayed on the EURUSD H1 chart, the indicator maps out multiple crucial levels. The red zones highlight major supply areas (where sellers dominate and push price down), while the orange zones track intermediate or freshly mitigated blocks where localized market reactions are highly probable.
Key Benefits and Core Features
- Automated Institutional Mapping: Instead of manually drawing zones and guessing where big money is resting, the indicator identifies and updates these high-volume regions automatically.
- Distinct Color-Coded Zones: The clean layout uses clear color variations to distinguish between primary macro supply/demand zones and secondary, short-term structural zones.
- Objective Risk Management: Because these zones represent structural walls on the chart, they give traders precise, logical areas to place protective stop-losses just outside the zone boundaries.
- Prevents Chasing the Market: By showing you exactly where price is extended, the indicator keeps you from buying into heavy supply or selling straight into deep demand.
How to Trade Using Supply and Demand Zones
The core logic behind this indicator is straightforward: you want to sell at supply and buy at demand. When price rallies into a red supply zone at the top of the chart, you look for bearish candlestick confirmation to trigger a short position, targeting the next orange or red structural zone below.
As seen on the right side of the EURUSD H1 chart, when price aggressively returns to a newly formed zone, it acts as a magnetic entry area. Traders can monitor how candles react to these color-coded boxes to catch major trend reversals right as the institutional orders fill, maximizing risk-to-reward ratios on every trade.
8 Downloads
Last Update:
May 23, 2026 01:22 AM
Published:
Jan 17, 2026 14:01 PM
Category: