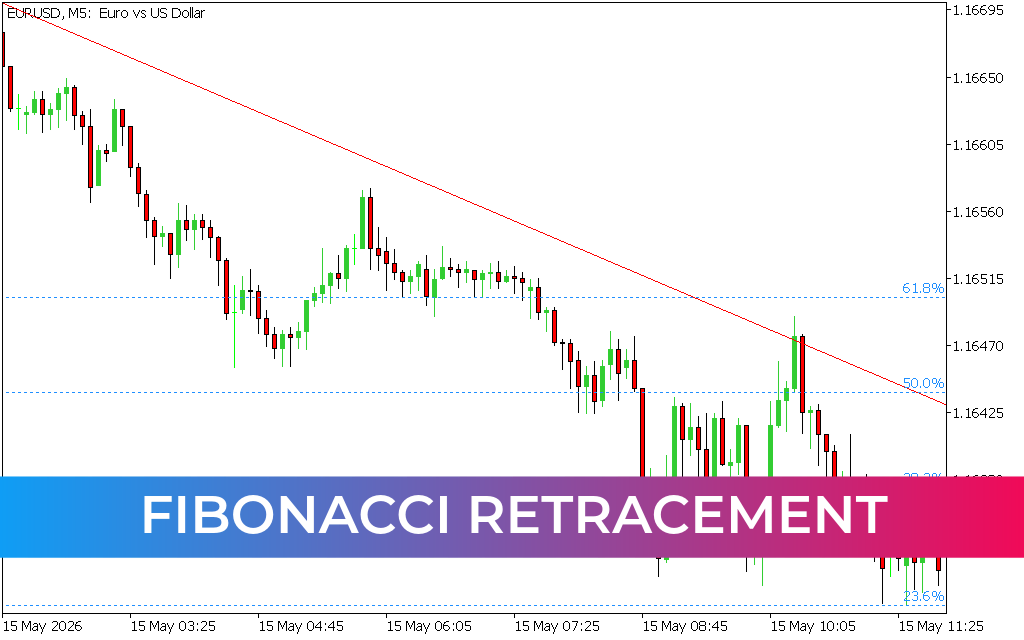
Mastering Key Intraday Levels with the Fibo Pivot V2 Indicator
In intraday Forex trading, success depends heavily on knowing where price is likely to stall, reverse, or breakout. While many traders waste precious time manually calculating daily Support And Resistance levels, professional market participants rely on mathematical frameworks to map out institutional order flow. The Fibo Pivot V2 indicator automates this entire process for MetaTrader users, merging classic floor pivots with Fibonacci golden ratios to project highly accurate mathematical key levels on your charts.
The Power of Merging Pivot Points and Fibonacci Ratios
Pivot points have long been a staple for floor traders and market makers to determine daily market bias. Traditional pivot points use simple arithmetic averages of the previous day's high, low, and close. However, the Fibo Pivot V2 takes this concept a step further by calculating key support and resistance extensions using Fibonacci retracement and expansion percentages.
By combining these two distinct analytical methodologies, the Fibo Pivot V2 generates structural lines that carry much higher confluence than standard support and resistance. When institutional algorithms hunt for liquidity, they consistently look for areas where multiple mathematical concepts align—making these levels highly predictive zones for Price Action.
Navigating the Visual Layout on Your Chart
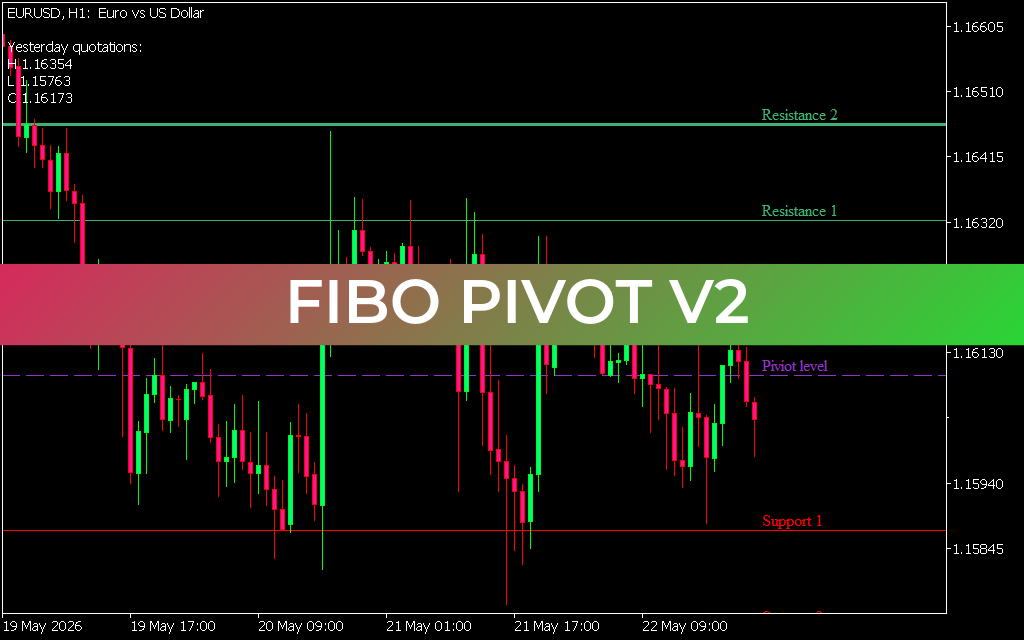
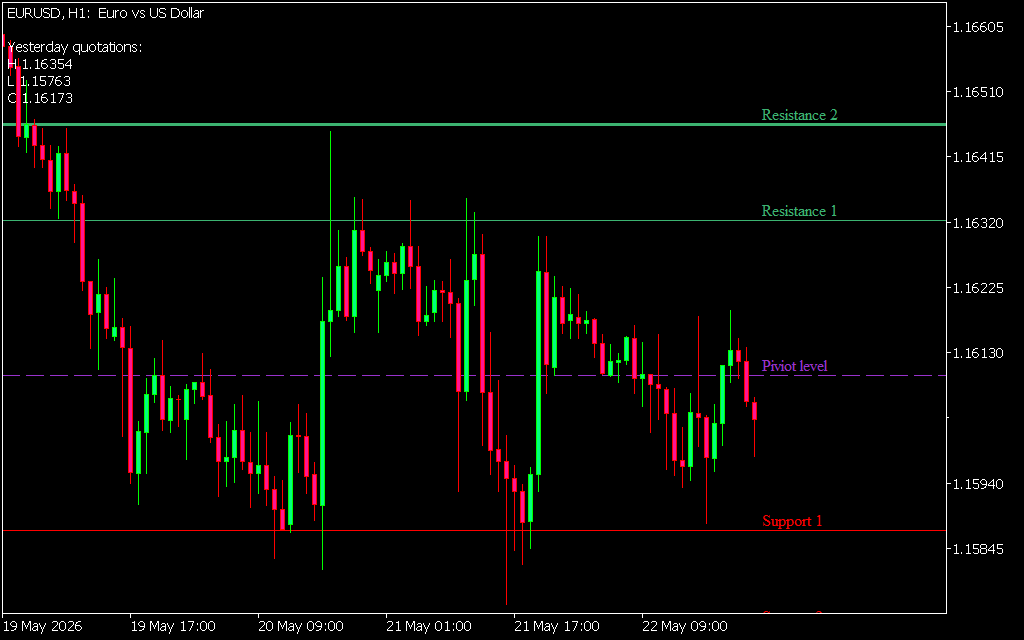
As displayed on the EURUSD H1 chart, the indicator completely streamlines daily market analysis by plotting clean, color-coded horizontal levels automatically at the start of each trading day:
- The Pivot Level (Purple Dashed Line): This serves as the ultimate line of demarcation for the session. Trading above the central pivot level establishes an intraday bullish bias, while trading below it indicates a dominant bearish bias.
- Resistance Levels (Green Lines): Labeled clearly as Resistance 1 and Resistance 2, these targets represent critical mathematical upside profit targets or potential zones for short-term counter-trend reversals.
- Support Levels (Red Lines): Marked as Support 1 (and Support 2 lower down), these zones highlight structural demand pockets where buying pressure is mathematically expected to enter the market.
The indicator also conveniently displays "Yesterday quotations" in the upper-left corner, providing an immediate reference point for yesterday's High, Low, and Close without cluttering the screen.
Building a Mechanical Trading System
The Fibo Pivot V2 is an exceptionally versatile tool that fits seamlessly into any trading style. For mean-reversion traders, a classic setup involves waiting for price to exhaust itself at Support 1 or Resistance 1, looking for candlestick rejection patterns to trade back toward the central Pivot Level.
For breakout traders, a decisive hourly candle close beyond Resistance 1 confirms an influx of institutional momentum, opening the door for a high-probability continuation play toward Resistance 2. By removing the guesswork from support and resistance placement, this tool allows you to execute your trading plan with mathematical consistency and absolute discipline.
2 Downloads
Last Update:
May 24, 2026 01:56 AM
Published:
Jan 15, 2026 20:28 PM
Category: