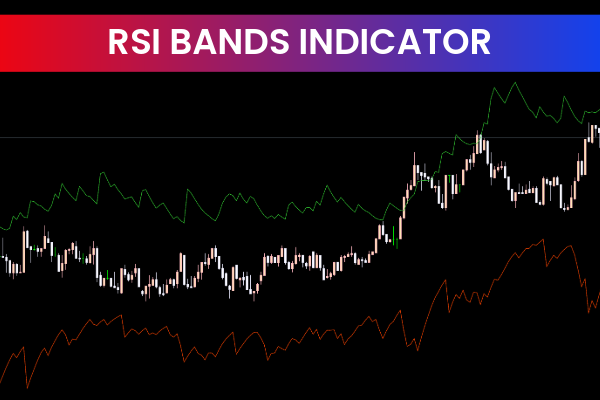
The RSI Bands Indicator MT5 is a popular and free Forex tool that helps traders identify potential overbought and oversold conditions. Built on the Relative Strength Index (RSI), this indicator enhances traditional RSI analysis by plotting upper and lower bands around the RSI line, based on standard deviation.
By using these bands, traders can detect market volatility, reversals, and breakout opportunities, making it a versatile tool for both short-term and long-term trading strategies.
How the RSI Bands Indicator MT5 Works
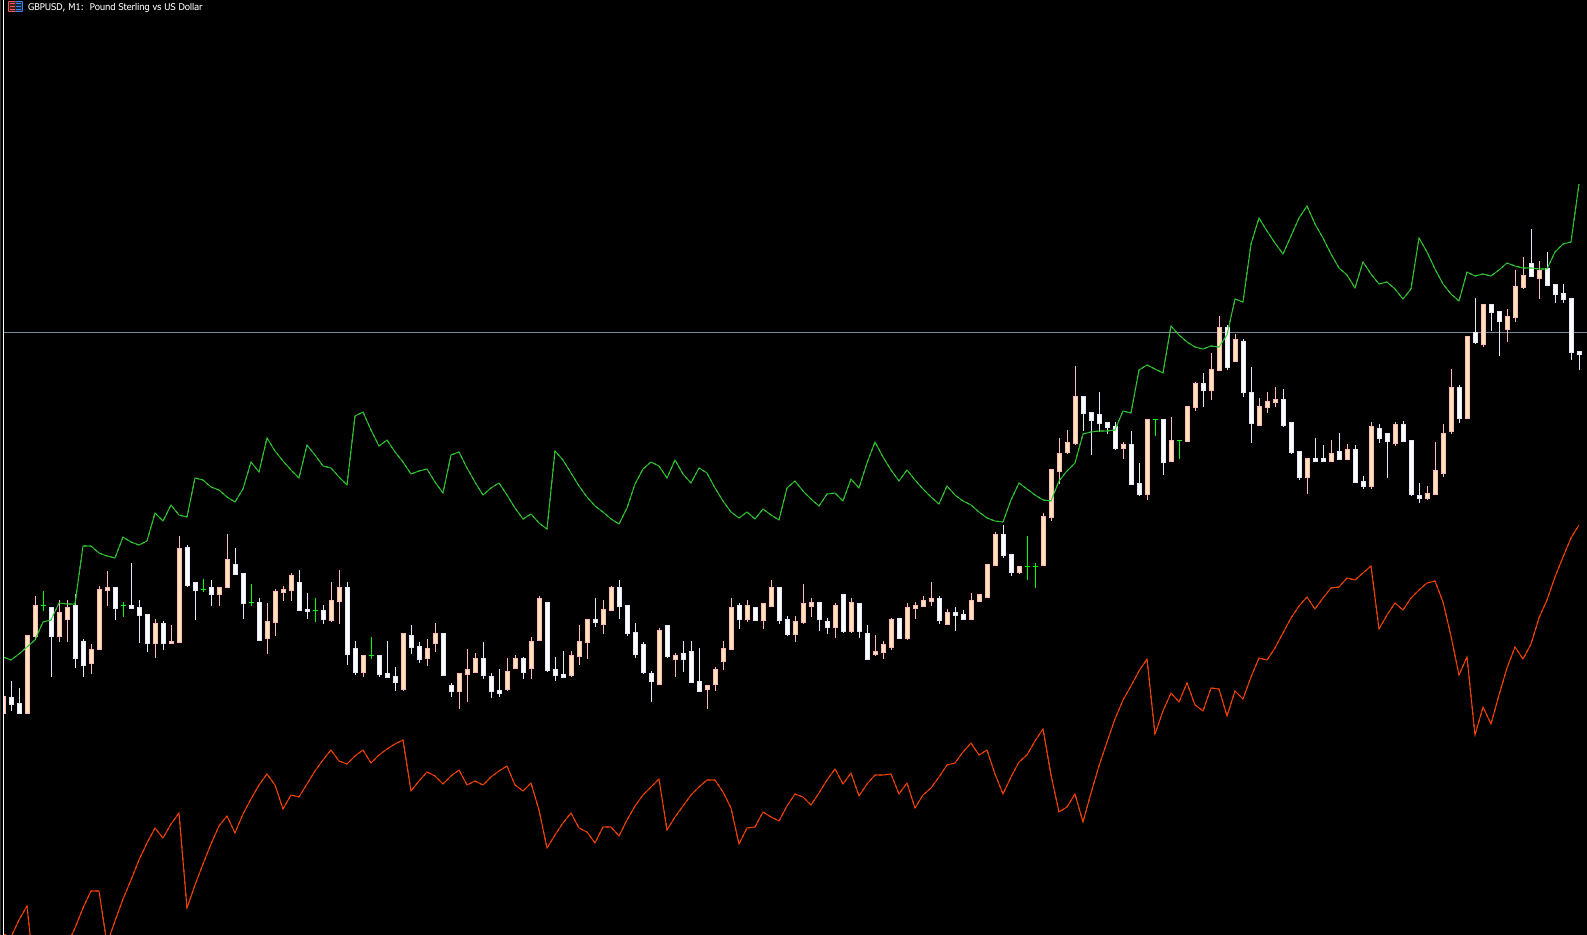
The indicator calculates bands around the RSI line using standard deviation to measure market volatility:
Upper Band – Marks potential overbought conditions
Lower Band – Marks potential oversold conditions
RSI Line – Measures momentum and price strength
When the RSI line moves outside the bands, it can signal a potential market reversal or trend change. Traders can use these signals to identify optimal entry and exit points or confirm breakouts in trending markets.
Key Features of RSI Bands Indicator MT5
Based on the Relative Strength Index (RSI)
Plots upper and lower volatility bands around the RSI line
Highlights potential overbought and oversold conditions
Can identify trend reversals and breakout opportunities
Works on all currency pairs and multiple timeframes
Free and fully compatible with MetaTrader 5
Easy to use and visually intuitive
This combination of features makes it suitable for a wide range of trading strategies, including swing trading, Scalping, and trend-following.
Trading Strategies Using RSI Bands Indicator MT5
Reversal Trading Strategy
Look for potential buy opportunities when the RSI line crosses below the lower band
Look for sell opportunities when the RSI line crosses above the upper band
Confirm reversal with price action or Candlestick Patterns
Breakout Strategy
Identify potential trend breakouts when the RSI line moves outside the bands and continues in the breakout direction
Use Support And Resistance levels or moving averages to confirm the trend
Place stop-loss orders just beyond recent swing points to minimize risk
Trend Confirmation Strategy
Use RSI Bands to filter trades in trending markets
Avoid trading when the RSI line is within the bands during choppy market conditions
By applying these strategies, traders can maximize profits and reduce false signals using the RSI Bands Indicator MT5.
Benefits of Using RSI Bands Indicator MT5
Identify Reversals – Quickly spot potential market turning points
Filter Trades – Helps differentiate between trending and ranging markets
Visual Signals – Easy-to-read charts for quick decision-making
Versatile – Works on multiple timeframes and currency pairs
Free MT5 Tool – Accessible to all traders
This makes the RSI Bands Indicator MT5 an essential tool for traders who want to analyze momentum and volatility simultaneously.
Best Practices for Traders
Combine RSI Bands with trend indicators such as moving averages or MACD
Use multiple timeframes to confirm overbought/oversold signals
Avoid trading solely based on RSI bands in highly choppy markets
Apply proper risk management for every trade
Following these best practices ensures higher-quality trade signals and more consistent results.
Conclusion
The RSI Bands Indicator MT5 is a free and powerful Forex tool that combines RSI momentum analysis with volatility bands to identify overbought, oversold, and breakout conditions. Traders can use it to spot reversals, trend changes, and optimal entry/exit points.
For more free MT5 indicators and professional Forex trading tools, visit IndicatorForest.com and enhance your trading performance.
2 Downloads
Published:
Jan 12, 2026 14:17 PM
Category: