Trade with Mathematical Certainty Using the ATR Probability Levels Indicator
One of the greatest challenges day traders face is predicting how far an asset's price can realistically move during a single trading session. Setting a take-profit target too far out results in watching a winning position reverse into a loss while placing a stop-loss too close leads to being prematurely stopped out by ordinary market noise.
The ATR Probability Levels indicator solves this dilemma. By anchoring your risk parameters to the mathematical realities of asset volatility, this elite tool projects dynamic, high-probability boundaries directly onto your charting setup.
What is the ATR Probability Levels Indicator?
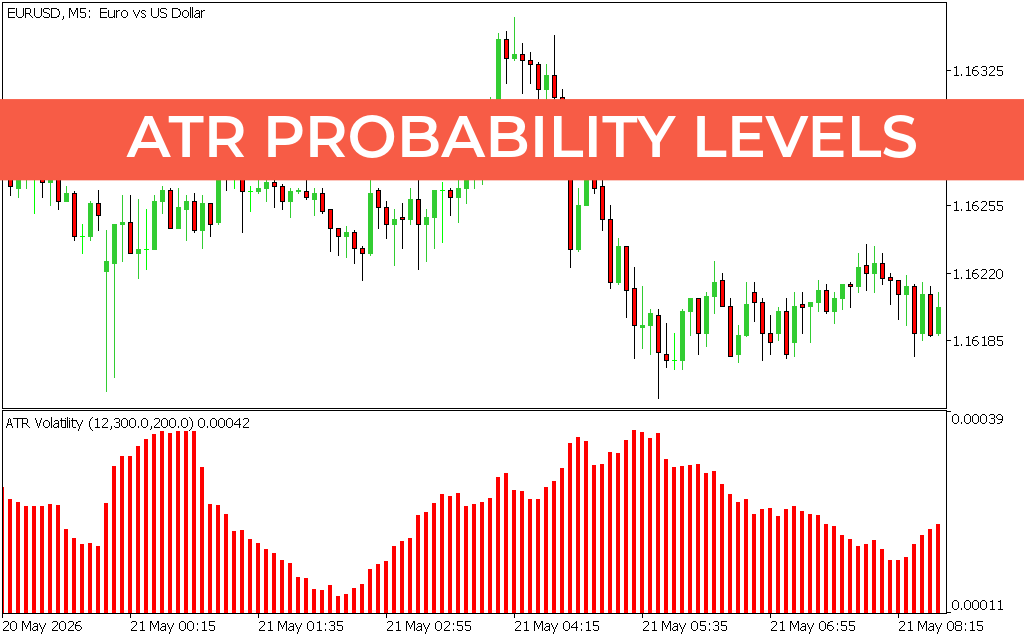
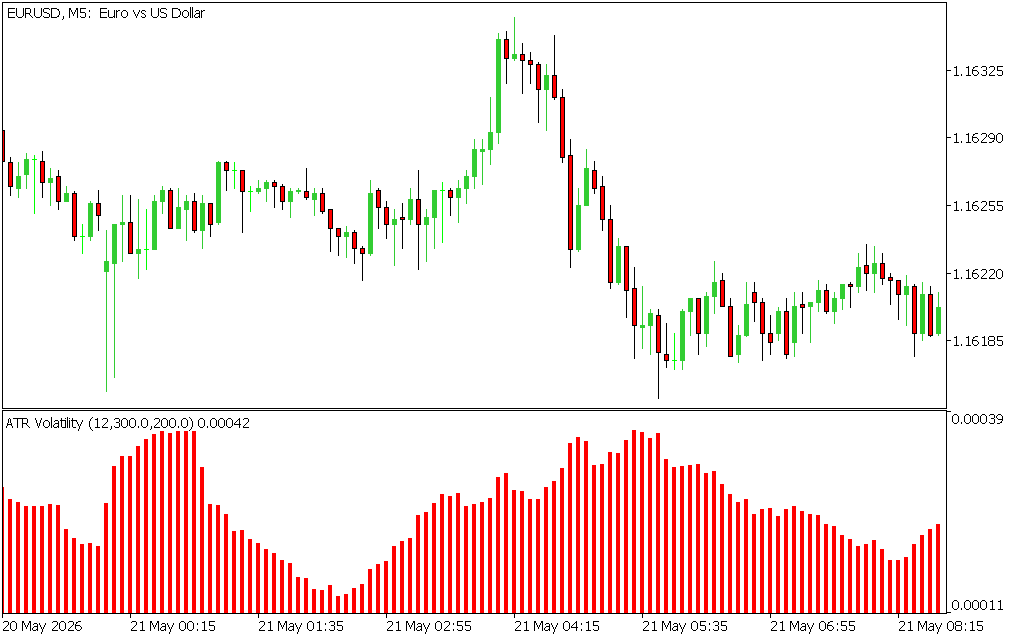
The ATR Probability Levels indicator is a sophisticated volatility calculator tailored for MetaTrader platforms. It utilizes the Average True Range (ATR)—the gold standard formula for measuring market velocity—and subjects it to advanced probability distribution models.
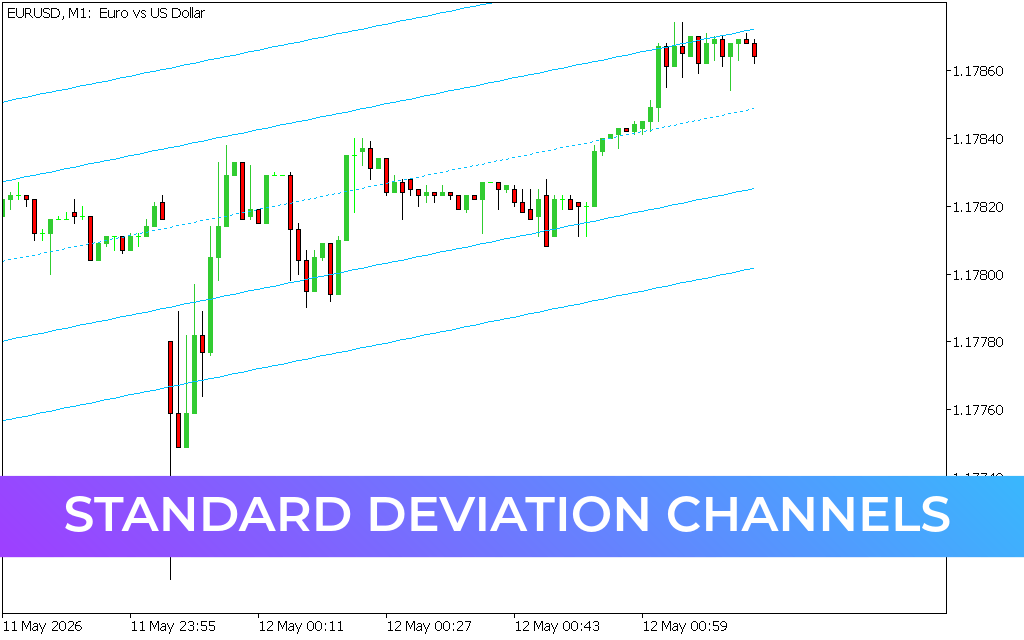
Instead of treating market ranges as static or arbitrary, this indicator calculates the true expansion potential of active price bars based on recent historical data. It projects clear, real-time upper and lower bands that represent statistical boundaries. Statistically, price is highly likely to remain within these calculated thresholds during standard market cycles, making the outer levels premium zones for mathematical exhaustions and trend targets.
Key Features and Strategic Advantages
- Math-Driven Target Projection: Instantly generates objective price targets rooted in real-time volatility rather than retail guesswork.
- Smart Stop-Loss Placement: Helps you position your protective stops completely outside ordinary market noise, drastically minimizing premature stop-outs.
- Dynamic Range Adaptability: The indicator bands automatically expand during highly volatile macroeconomic news events and contract during quiet, low-liquidity trading sessions.
- Flawless Intraday Performance: Highly optimized across various chart settings, delivering institutional precision whether you are Scalping the M5 or swing trading the M15 and hourly frames.
How to Trade with ATR Probability Levels
This analytical tool enhances your mechanical execution by providing mathematical boundaries for every position you initiate:
1. Precision Take-Profit Mapping
When you enter a trend continuation trade, do not pick an arbitrary target. Look at the upper or lower ATR Probability bands. Setting your take-profit order just inside these calculated boundaries maximizes your chances of getting filled before institutional mean-reversion forces pull the price back down.
2. Institutional Mean-Reversion Reversals
On typical trading days, the extreme outer bands represent areas of statistical exhaustion. If price accelerates rapidly and touches the outer ATR band while an oscillator shows extreme overbought or oversold conditions, it signals a high-probability opportunity to trade a sharp counter-trend reversion back toward the median.
3. True Breakout Verification
If Price Action breaks cleanly through an ATR Probability band with expanding volume, it confirms an extraordinarily rare and powerful institutional expansion phase. Traders can comfortably look for continuation setups, knowing the move is backed by true market momentum.
Conclusion
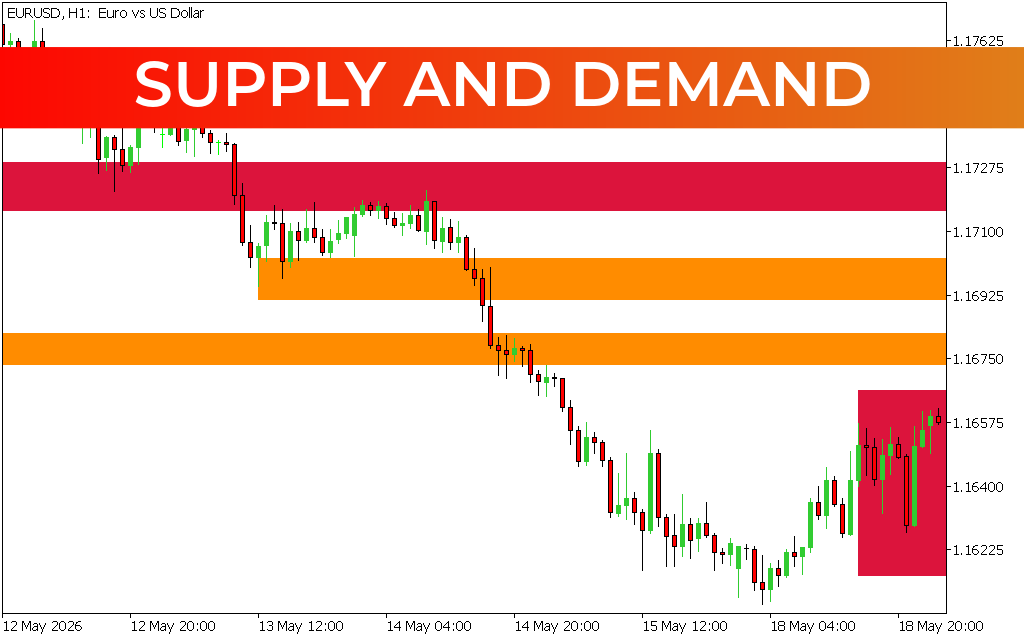
Relying on static Support And Resistance lines in a dynamic market is a major competitive disadvantage. The ATR Probability Levels indicator equips your MetaTrader setup with a live, volatility-adjusted mathematical map. Upgrade your charting system today to start placing your entries, targets, and stops with absolute statistical confidence.
3 Downloads
Last Update:
May 21, 2026 16:41 PM
Published:
Jan 17, 2026 20:00 PM
Category: