Navigating Market Volatility with Standard Deviation Channels
In the world of technical analysis, Price Action rarely moves in a straight line. Instead, it fluctuates around a mean, creating "noise" that can confuse even experienced traders. The Standard Deviation Channels indicator is a premier tool designed to filter this noise, providing a mathematically sound framework for understanding Trend Strength and potential exhaustion points.
What is a Standard Deviation Channel?
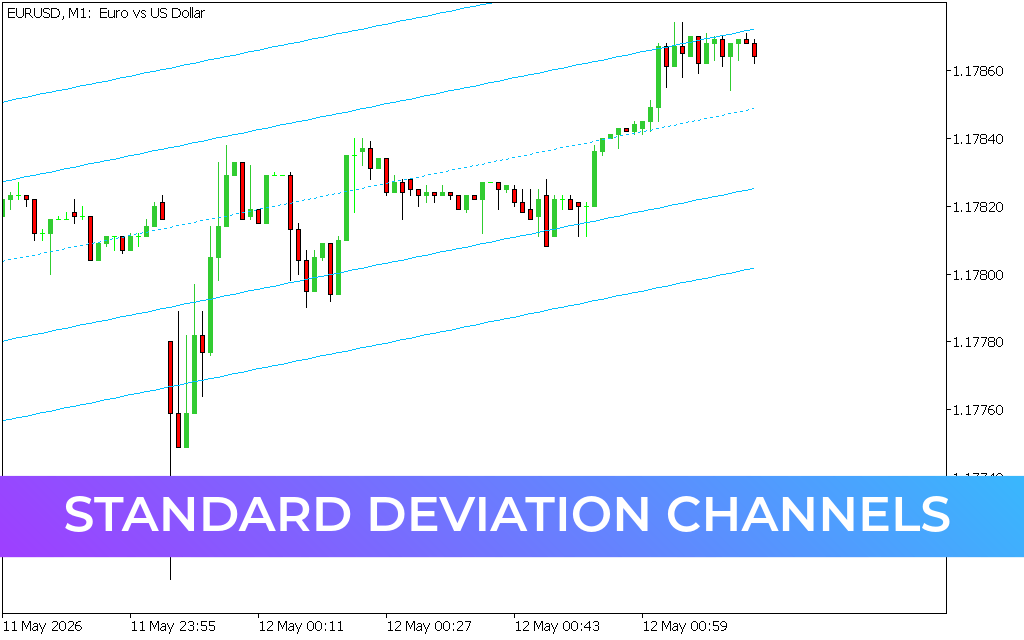
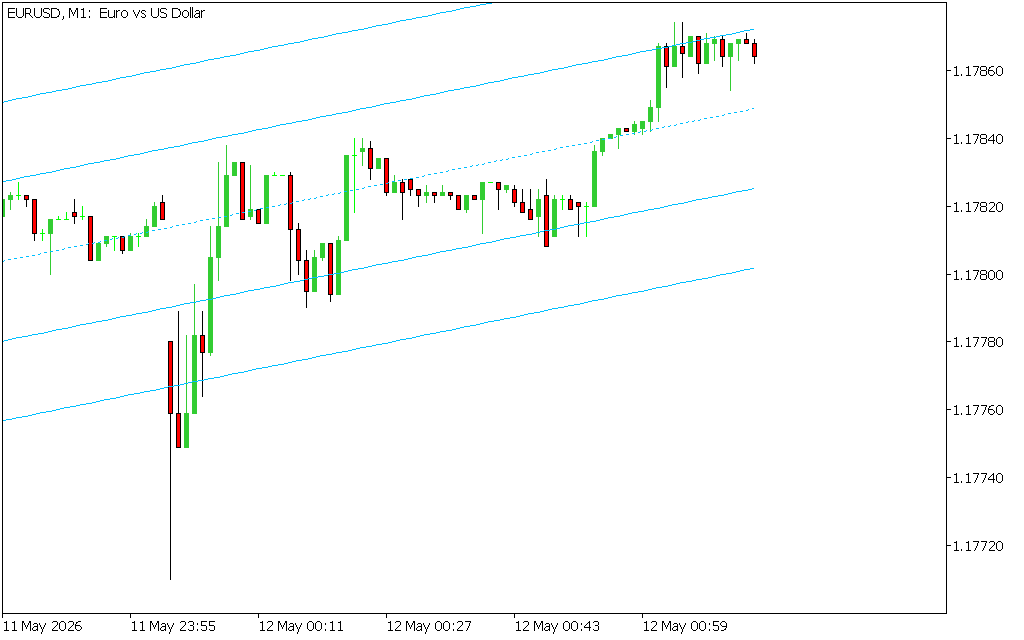
The Standard Deviation Channel is a three-line indicator plotted directly onto the price chart. It is based on a linear regression trend line, which represents the "fair value" or mean price over a specific period.
- The Median Line: This is the linear regression line that best fits the price data, showing the overall trend direction.
- The Outer Channels: Two parallel lines are plotted above and below the median line. The distance between these lines and the median is determined by the number of standard deviations—a statistical measure of market volatility.
By using standard deviation, the channel automatically expands during high-volatility periods and contracts when the market is quiet, making it far more adaptive than fixed-width channels.
The Power of Mean Reversion and Breakouts
The core philosophy behind this indicator is that price is likely to stay within the channel most of the time. Statistically, if you set the indicator to two standard deviations, approximately 95% of all price action should occur within the channel boundaries.
- Overbought/Oversold Signals: When the price touches or exceeds the upper channel line, the asset is statistically "overextended" to the upside, signaling a high probability of a reversal back toward the median. Conversely, touches of the lower line suggest an oversold condition.
- Trend Confirmation: As long as the price remains within the channel and the channel is sloped upward, the bullish trend is considered healthy.
- Volatility Breakouts: If the price closes decisively outside the outer bands, it often signals a "volatility breakout," suggesting that a new, even stronger trend is forming.
Why Traders Prefer This Indicator
Unlike standard trendlines that are drawn subjectively from one peak to another, Standard Deviation Channels are strictly objective. They rely on cold, hard data to determine where the market "should" be trading. This makes them an invaluable asset for day traders and scalpers who need to make quick decisions based on statistical probability rather than gut feeling.
Whether you are trading the EUR/USD on a 1-minute chart or analyzing stocks on a daily timeframe, this indicator provides a clear visual map of Support And Resistance. It allows you to enter trades at the edges of the channel where the risk-to-reward ratio is highest, ensuring you aren't "buying the top" or "selling the bottom."
2 Downloads
Last Update:
May 12, 2026 03:15 AM
Published:
Jan 24, 2026 12:57 PM
Category: