Master Market Volatility with the Dynamic Trends Indicator
In the rapidly evolving financial markets, static trading strategies often lead to missed opportunities or premature exits. Professional traders understand that price movement is fluid, requiring tools that adapt to shifting momentum in real-time. The Dynamic Trends indicator is a premier technical solution designed to provide structural clarity by mapping trend boundaries and high-probability entry points directly onto your trading terminal.
Adaptive Market Geometry
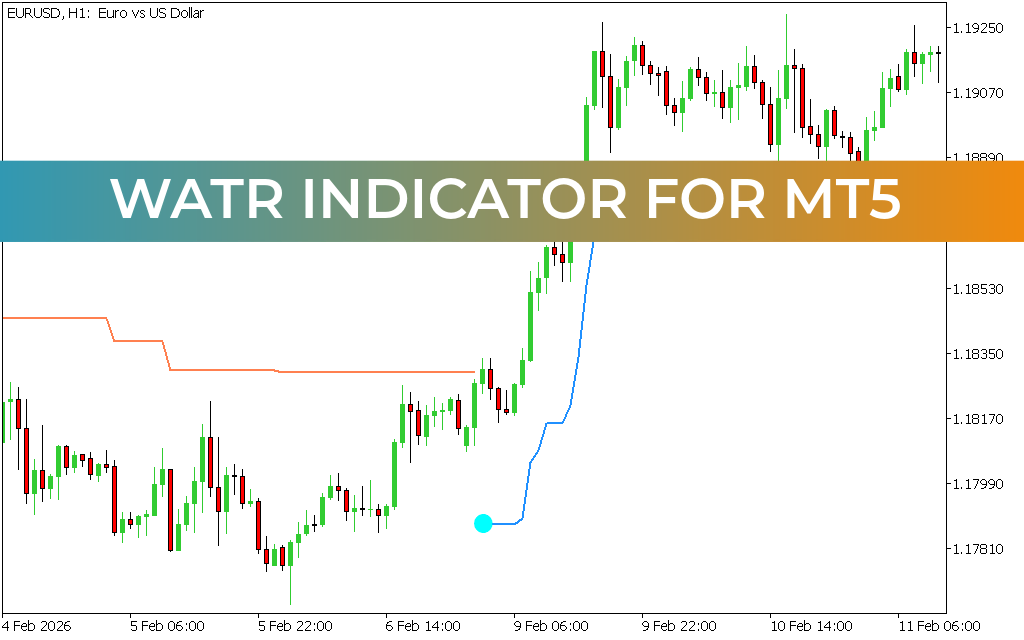
The Dynamic Trends indicator utilizes a sophisticated algorithm to establish a "trading corridor" based on current market volatility and price action. Unlike standard trendlines that require manual adjustment, this tool automatically projects dynamic Support And Resistance levels that evolve as new data enters the market.
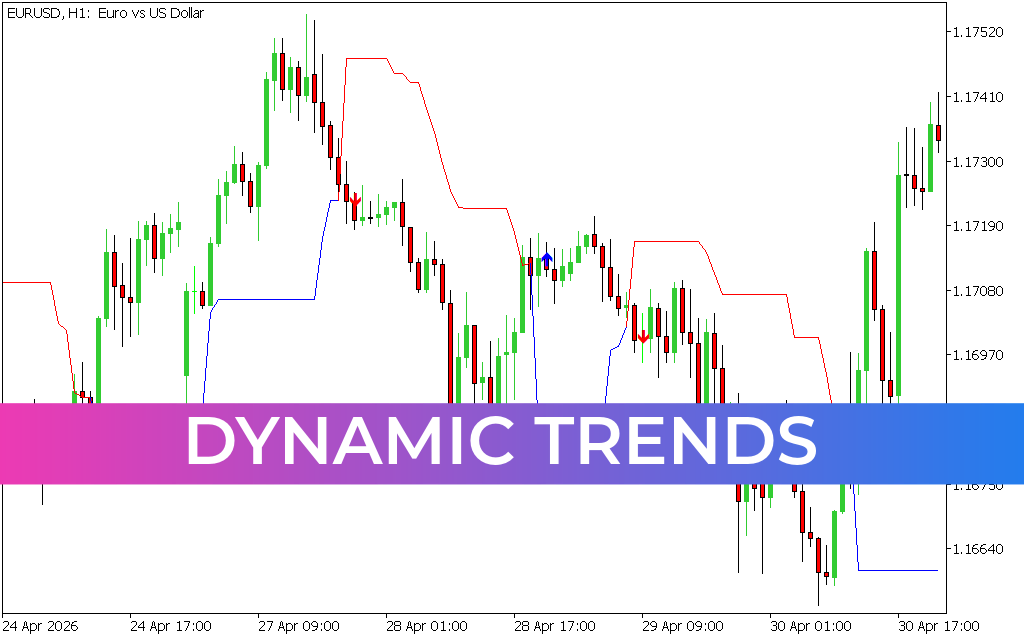
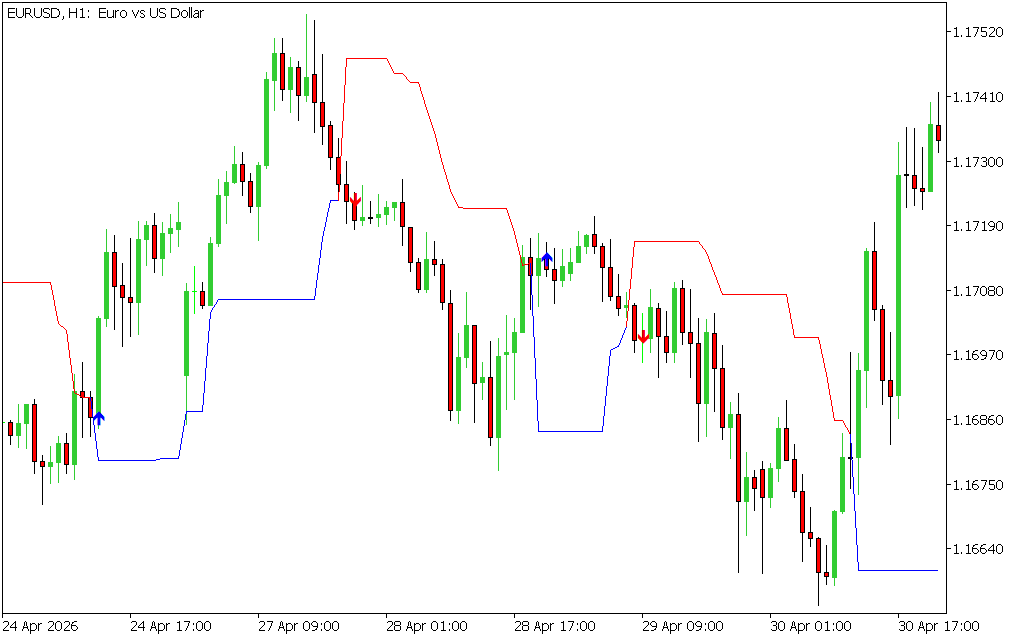
As seen in the provided chart of EURUSD H1, the indicator manifests as a dual-line system:
- The Red Resistance Line: Acts as a descending ceiling during bearish phases, identifying zones where selling pressure is likely to resume.
- The Blue Support Line: Serves as an ascending floor during bullish expansions, pinpointing areas where buyers are stepping back into the market.
This visual framework allows traders to stay on the right side of the "path of least resistance," ensuring they aren't fighting against the prevailing market force.
Precision Signaling with Zero Ambiguity
One of the standout features of Dynamic Trends is its integrated arrow signal system. By combining trend boundary analysis with momentum shifts, the indicator provides clear, non-discretionary triggers:
- Blue Upward Arrows: Signal a bullish breakout or a successful test of the dynamic support line, marking a prime opportunity for long entries.
- Red Downward Arrows: Signal a bearish breakdown or a rejection at the dynamic resistance line, providing a high-probability trigger for short positions.
In the EURUSD H1 example, notice how the signals appear at critical structural pivots, allowing traders to capture the "meat" of a move while avoiding the noise of minor consolidations.
Key Benefits for Modern Traders
- Volatility-Adjusted Levels: Because the lines are dynamic, they expand during high-volatility events and contract during quiet periods, providing a more accurate representation of "value" than fixed levels.
- Optimized for Multi-Timeframe Analysis: While exceptionally clear on the H1 chart for swing trading, Dynamic Trends is robust enough for M1 Scalping or Daily position trading.
- Integrated Trade Management: The dynamic lines serve as excellent trailing stop-loss markers. By following the blue or red line, traders can protect their capital and lock in profits as the trend matures.
- Institutional-Grade Clarity: This tool strips away the chaos of raw price action, revealing the underlying Market Structure used by professional desks to manage risk.
Conclusion
The Dynamic Trends indicator is an essential asset for any trader who values objectivity and adaptability. By providing a clear visual roadmap of market momentum and precision entry signals, it empowers you to trade with professional-grade confidence. Whether you are navigating volatile currency pairs or tracking global indices, Dynamic Trends ensures you are always prepared for the market's next move.
1 Download
Last Update:
May 06, 2026 21:46 PM
Published:
Jan 26, 2026 19:22 PM
Category: