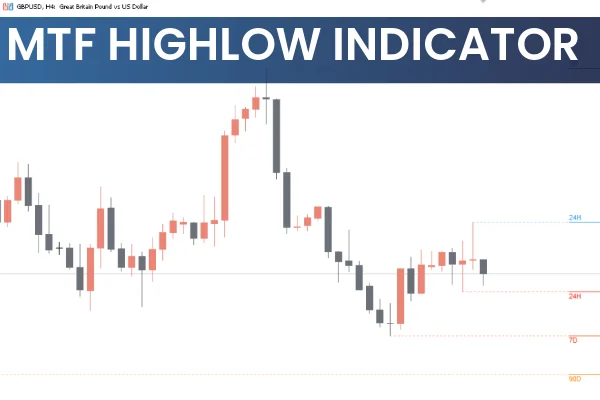
The MTF High Low Indicator for MT5 (Multi-Timeframe High Low Indicator) is a powerful forex tool designed to automatically plot the previous high and low levels from various timeframes — daily, weekly, monthly, or even yearly — directly on your chart.
These levels are essential to Market Structure, as they represent key price zones where institutional traders, banks, and hedge funds often make major trading decisions. By displaying these levels as labeled lines (e.g., 24H, 1W, 1M), traders gain immediate visual access to areas of potential support and resistance.
The indicator is highly customizable. You can adjust the colors, visibility, and even add dotted projections or price tags to make the levels more noticeable.
Why the MTF High Low Indicator Is Important
Day traders and scalpers often focus on small fluctuations and may miss the broader picture. The MTF High Low Indicator bridges this gap by integrating higher timeframe levels into your lower-timeframe charts.
For example, when trading on a 5-minute chart, you can still see the previous day’s high and low, helping you avoid false signals and align with larger market trends.
How to Trade Using the MTF High Low Indicator
Unlike oscillators or signal generators, the MTF High Low Indicator doesn’t provide direct buy or sell arrows. Instead, it highlights key zones where you can base high-probability trading decisions.
Example Trading Approach
On the GBPJPY M5 chart, the Red 24H line represents the previous day’s low.
Initially, this level acted as support, with price bouncing upward.
After a bearish breakout, it turned into resistance — a classic case of role reversal.
Here’s how you can trade such setups:
Wait for price interaction with a key level (e.g., previous day’s high or low).
Confirm the reaction using one or more of the following methods:
Candlestick Patterns (e.g., pin bars, engulfing candles).
Oscillator confirmation such as Momentum or RSI.
Trendline or channel validation.
Enter in the direction of the breakout or rejection, depending on confirmation.
Place stop-loss orders just beyond the marked level.
Maintain a positive risk-to-reward (R:R) ratio — ideally 1:2 or higher.
Key Features and Settings
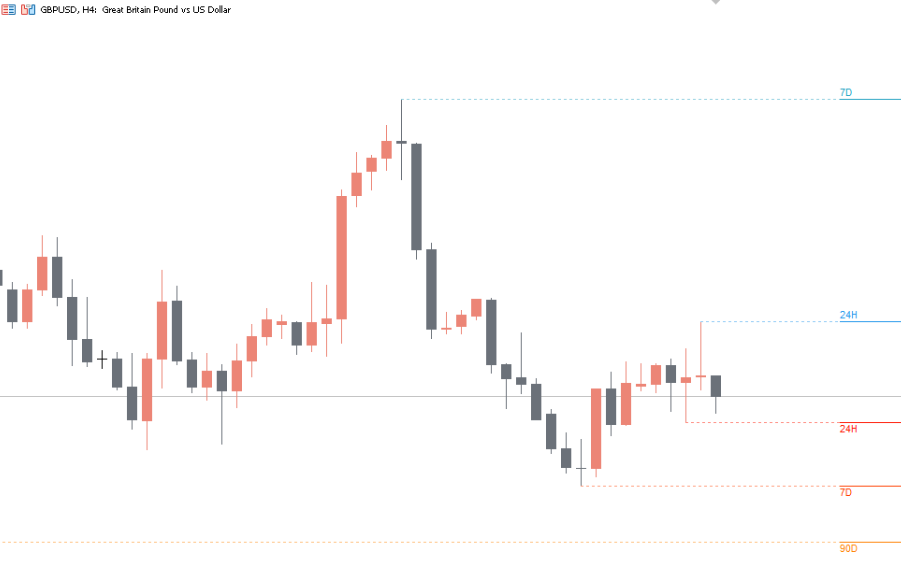
The MTF High Low Indicator automatically detects and displays:
High and Low of the previous day.
High and Low of the previous week.
High and Low of the previous month.
High and Low of the previous year.
You can customize:
Colors and line styles (solid, dotted, dashed).
Price labels for each timeframe.
Projection extensions for better visual clarity.
Visibility for specific timeframes only (e.g., show weekly and monthly only).
These settings allow you to tailor the indicator to your trading strategy and charting style.
Trading Tips
Combine the indicator with other tools such as MACD, RSI, or Moving Averages for stronger confirmations.
Always consider higher-timeframe trends before entering trades on shorter charts.
Avoid trading blindly off these levels — use them as context for decision-making.
Practice first on a demo account to understand how price reacts to these zones.
Conclusion
The MTF High Low Indicator for MT5 is an indispensable tool for traders seeking to understand market structure through key highs and lows across multiple timeframes. By integrating these vital zones directly into your trading chart, it helps you:
Identify true Support And Resistance areas.
Align trades with higher-timeframe trends.
Plan more accurate entries and exits.
Filter out false breakouts and noise on lower timeframes.
No indicator guarantees profits, but the MTF High Low Indicator gives you the strategic advantage of trading where the market truly makes decisions.
Download the MTF High Low Indicator for MT5 for free at IndicatorForest.com and enhance your market precision today.
FAQ
8 Downloads
Published:
Nov 11, 2025 12:42 PM
Category: