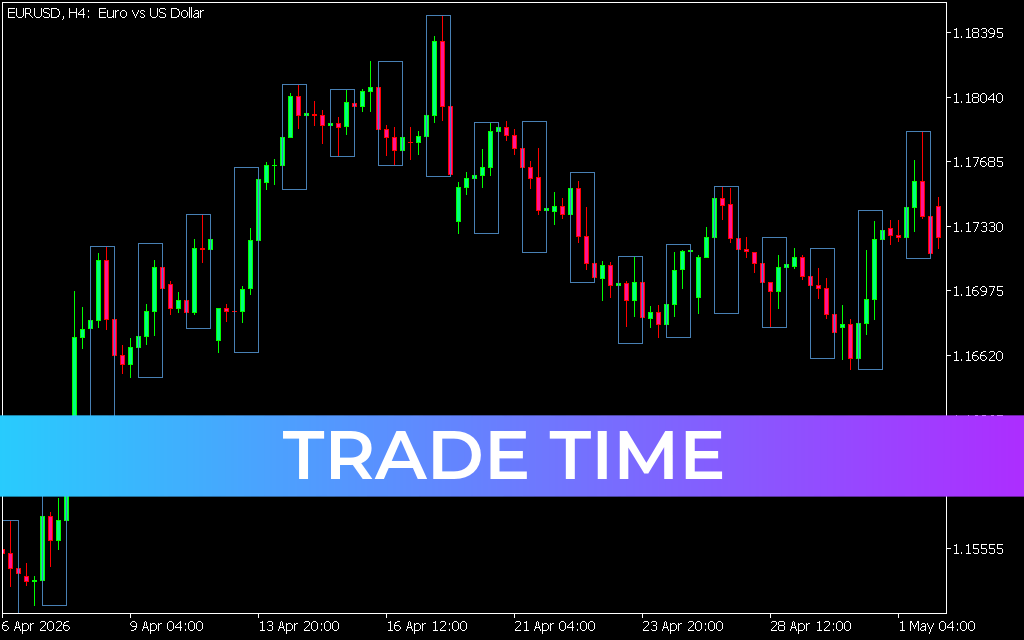
Mastering Key Psychological Zones: A Guide to the Price Grid Indicator for MT5
In the financial markets, price does not move at random. If you study historical charts across any asset class, you will notice that price action frequently reacts, stalls, or aggressively reverses around specific round numbers and evenly spaced intervals. These structural areas are known as psychological Support And Resistance zones. For MetaTrader 5 (MT5) traders looking to map out these institutional decision points automatically, the Price Grid indicator serves as an essential framework for clear chart organization.
What is the Price Grid Indicator?
The Price Grid indicator is a technical mapping tool designed to overlay a systematic, evenly spaced grid of horizontal lines across your trading terminal. Instead of forcing traders to manually calculate and draw static lines every morning, this software handles the geometry programmatically based on user-defined pip intervals (such as every 50 or 100 pips).
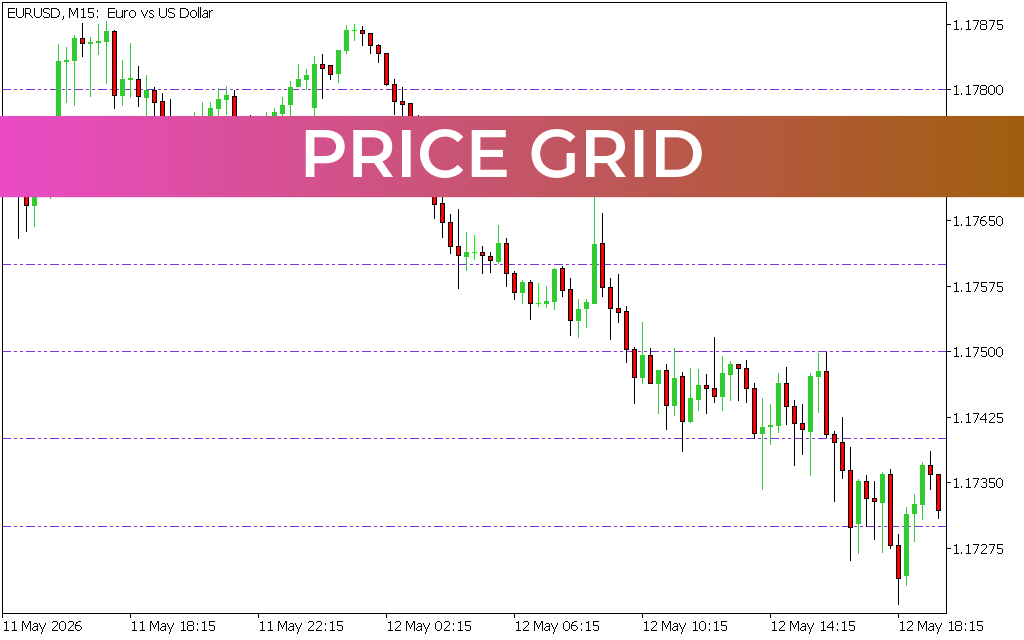
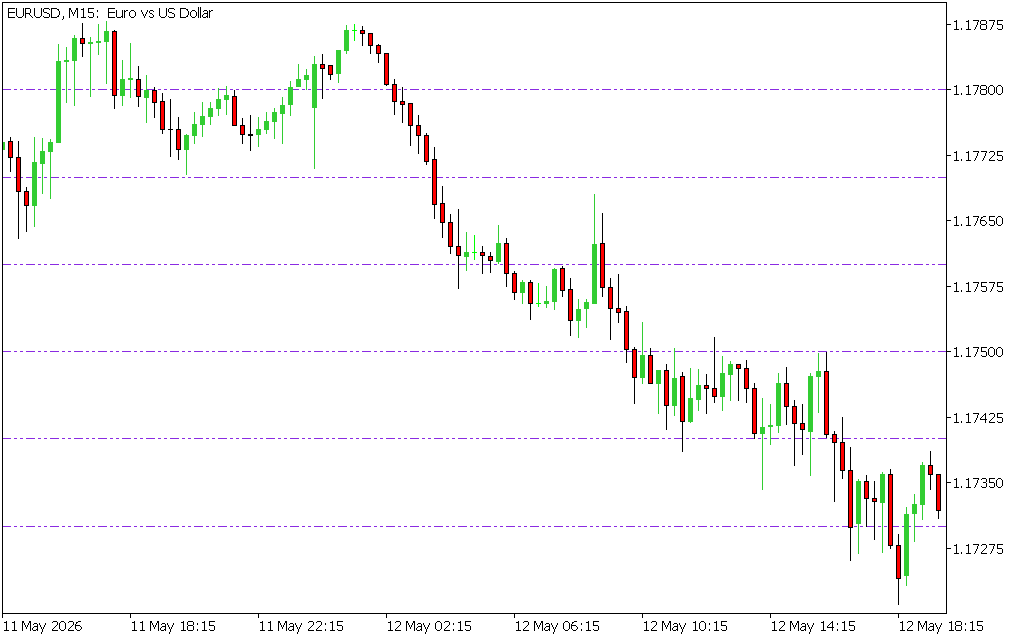
As demonstrated in the EURUSD M15 chart, the indicator replaces standard chart background clutter with a beautifully clean, unified visual hierarchy:
- Purple Dashed Grid Lines: Plot precise, mathematical price levels horizontally across the chart panel (e.g., matching milestones like 1.17350, 1.17500, and 1.17650).
- Unobstructed View: By utilizing crisp, dashed formatting, the grid stays cleanly in the background, allowing traders to monitor candlestick formations and raw structural patterns without visual distraction.
High-Probability Trading Strategies with Price Grid
Integrating a structured grid system into your daily MT5 layout provides critical technical advantages across several trading methodologies:
- Grid-Based Mean Reversion: Round psychological levels act like magnets for price. When an asset experiences an aggressive, low-volume extension away from a major grid coordinate, quantitative day traders look for signs of exhaustion to execute counter-trend trades, targeting a swift return back to the nearest grid milestone.
- Breakout Confirmation Zones: Major market moves frequently ignite right around psychological boundaries. As shown on the M15 chart, tracking a high-volume candlestick break and close below a specific purple grid line provides an objective confirmation factor to enter a short position, safely targeting the next step lower on the grid matrix.
- Perfect Risk Management Management: One of the most practical applications of the Price Grid is establishing objective stop-losses and take-profit targets. Instead of placing random targets, placing your stop-loss just past an overhead grid line ensures your risk is hidden behind a mathematically verified structural wall.
Engineered for the Advanced MT5 Infrastructure
The MetaTrader 5 engine is celebrated for its precise sub-millisecond data processing. The Price Grid indicator is fully optimized for this high-performance architecture, recalculating the coordinate spaces instantly as you scroll through historical data or scale your terminal window. This real-time scaling ensures that the horizontal zones remain mathematically perfect whether you are Scalping the M1 chart or tracking macro shifts on the H4 timeframe.
Conclusion
The Price Grid indicator for MT5 transforms a chaotic price chart into an organized, institutional-grade layout. By automatically projecting core psychological milestones, it removes the subjectivity of technical analysis and streamlines execution.
4 Downloads
Last Update:
May 16, 2026 03:23 AM
Published:
Jan 21, 2026 13:41 PM
Category: