Unlock Market Geometry with the Murrey Math Indicator for MT5
In the realm of advanced technical analysis, few tools offer the structural clarity and predictive power of the Murrey Math Indicator. Based on the complex geometric principles of W.D. Gann, T. Henning Murrey developed this system to prove that all financial markets behave according to a specific set of mathematical laws. The Murrey Math Indicator for MetaTrader 5 (MT5) automates this intricate process, providing traders with a robust framework for identifying support, resistance, and potential trend reversals with mathematical precision.
The Fractal Nature of Price Action
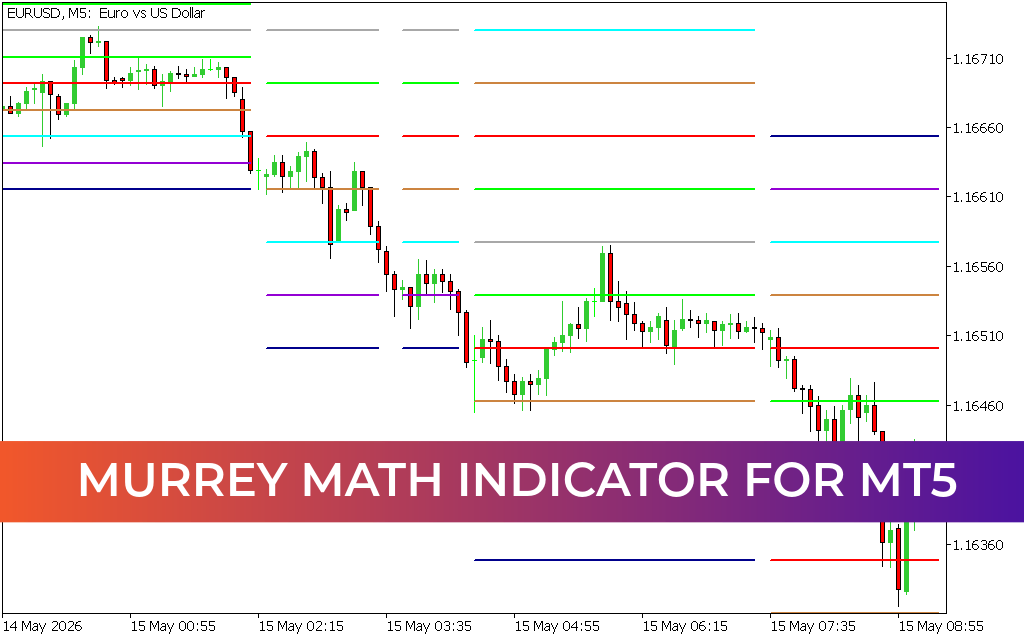
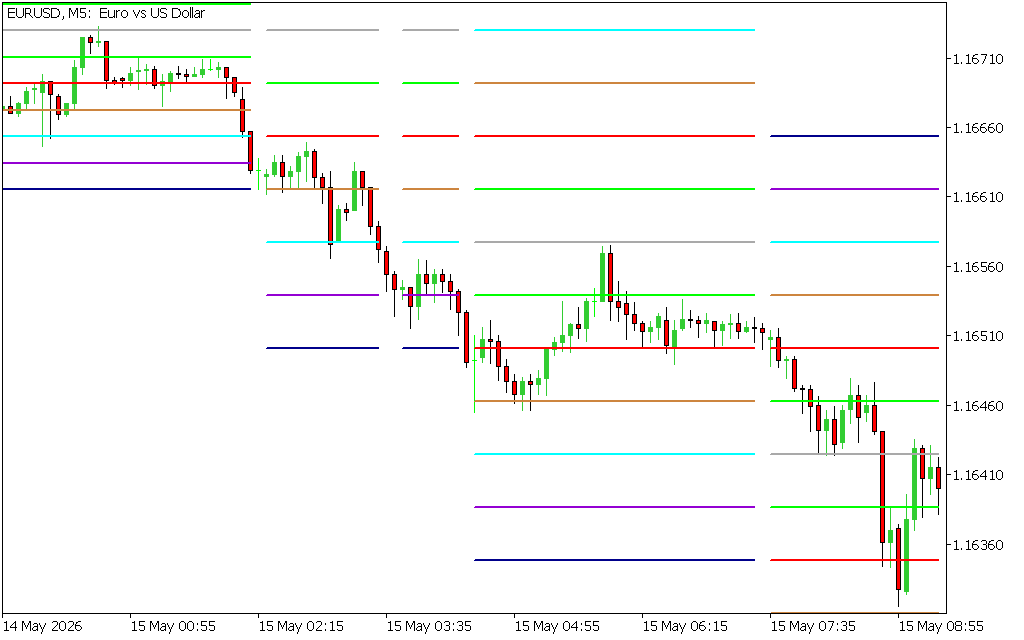
At its core, Murrey Math assumes that price moves in "octaves." The indicator divides any given price range into eight equal segments, known as 1/8 increments. These levels act as psychological and mathematical boundaries where price is statistically likely to react. Unlike standard Support And Resistance lines that are drawn subjectively, Murrey Math levels are fixed based on the current market fractal, ensuring an objective view of the market.
As demonstrated in the EURUSD M5 analysis, the indicator populates the chart with color-coded horizontal lines, each representing a specific "square" in the market's geometry. These levels are not merely price points; they are indicators of market sentiment and momentum exhaustion.
Key Levels and Their Meanings
The Murrey Math system categorizes its eight octaves into specific functional zones, allowing traders to anticipate the next move:
- 4/8 (The Major Support/Resistance): This is the central pivot point of the entire system. It is the most significant level; price typically spends more time here than anywhere else.
- 0/8 and 8/8 (Ultimate Support/Resistance): These are the hardest levels to break. When price hits these boundaries, it is considered extremely overextended, and a major reversal is often imminent.
- 1/8 and 7/8 (Weak, Stall, and Reverse): If price is trending and hits these levels, it often stalls. If it cannot break through, a snap-back to the 4/8 median is common.
- 3/8 and 5/8 (Trading Range): If price stays between these two levels, the market is in a state of equilibrium or consolidation.
Strategic Execution on MT5
The Murrey Math Indicator is particularly powerful for mean-reversion strategies and breakout filtering. By observing the interaction between price and the octave lines on an M5 chart, traders can identify "low-risk, high-reward" entry zones.
For instance, when price reaches the -1/8 or -2/8 (Oversold) levels, it suggests that the downward momentum is unsustainable. Conversely, the +1/8 and +2/8 (Overbought) levels signal that the market is due for a bearish correction. MetaTrader 5's high-speed processing ensures these levels update dynamically as the market moves through different price fractals, keeping the trader aligned with the most current data.
Why Choose Murrey Math for Your MT5 Setup?
Unlike lagging oscillators, Murrey Math is a leading indicator. It tells you where the market is going before it gets there. It removes the emotional stress of trading by providing a clear, rule-based map of the market. Whether you are a scalper looking for quick turns at the 1/8 levels or a swing trader aiming for the 8/8 targets, the Murrey Math Indicator for MT5 is an indispensable tool for mastering market rhythm and geometry.
3 Downloads
Last Update:
May 15, 2026 17:00 PM
Published:
Jan 21, 2026 18:39 PM
Category: