Understanding the EUR/USD H1 Market Trend
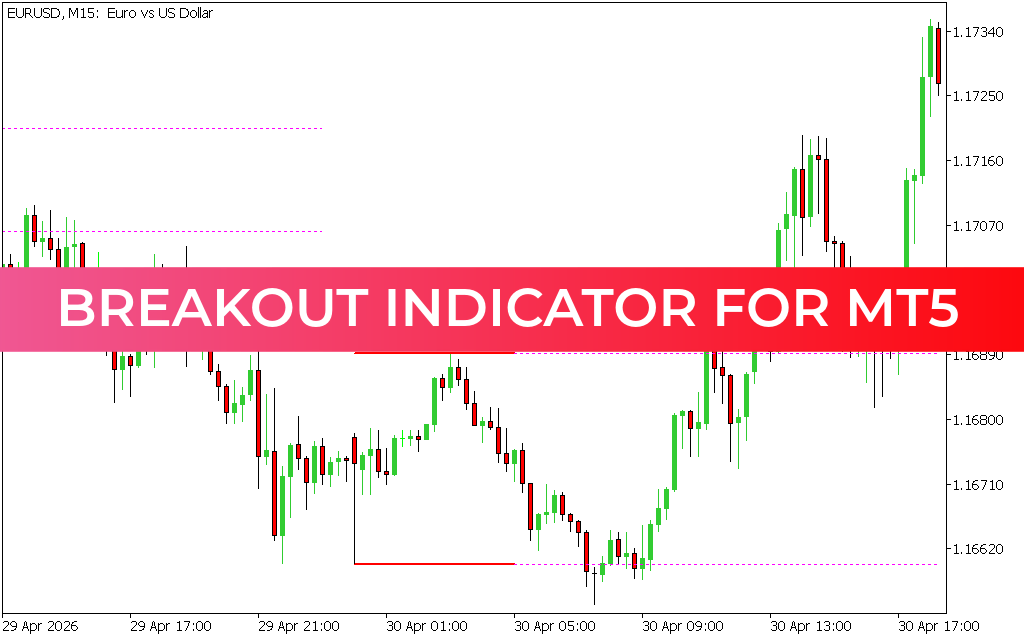
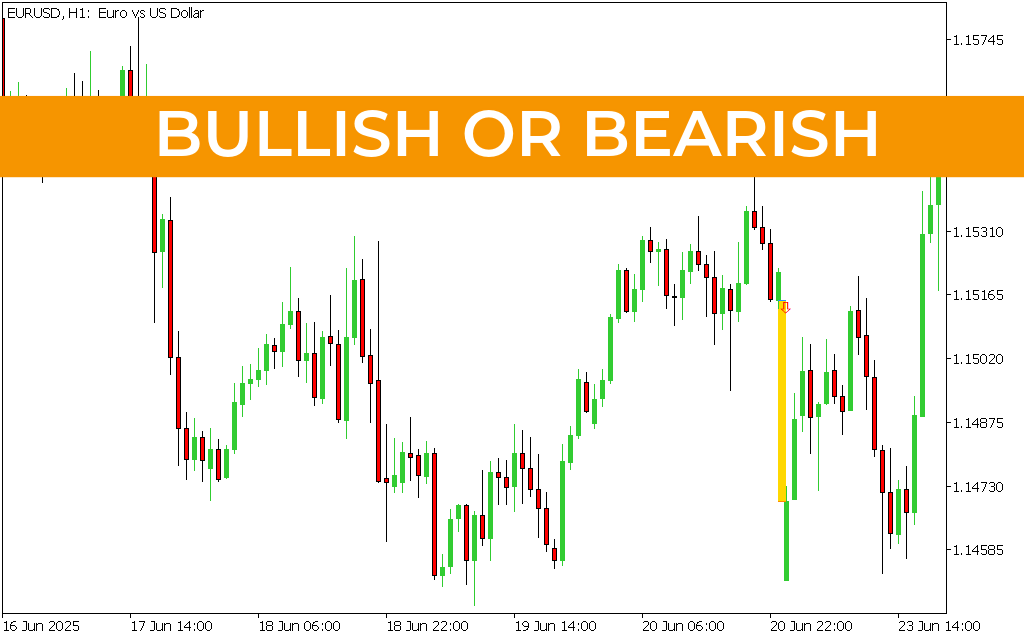
The EUR/USD 1-hour (H1) chart displays a classic example of high-velocity market volatility, offering critical insights for both short-term swing traders and day traders. When analyzing this specific Price Action, the overarching sentiment leans bearish to neutral in the medium term, but with a strong immediate bullish reaction off major structural support.
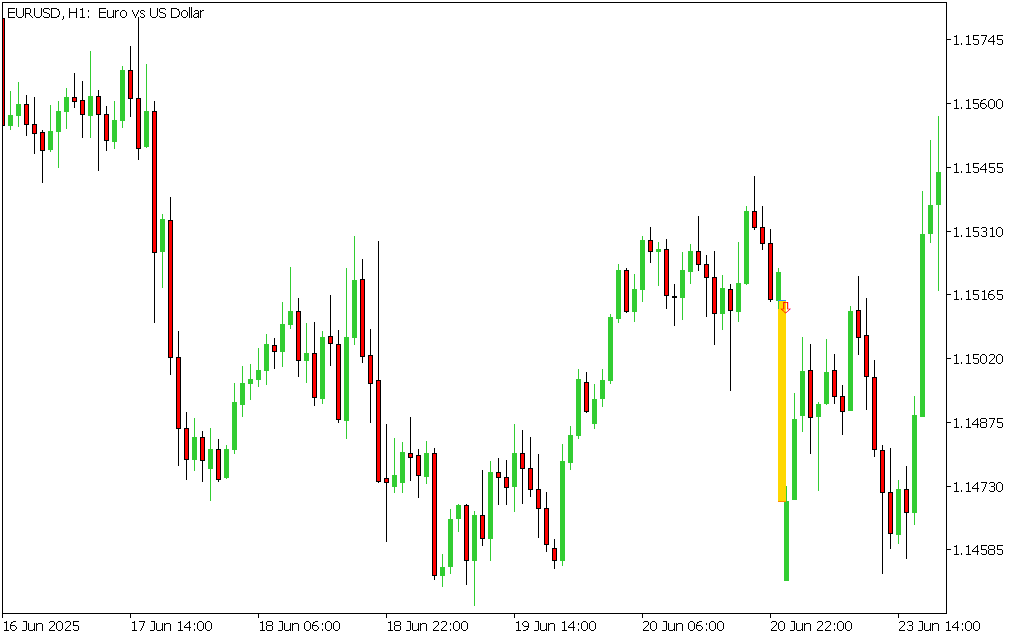
Initially, the asset experienced a significant downward trajectory from the 1.15745 resistance zone. This distribution phase led to a prolonged markdown, driving price down toward the 1.14585 liquidity pool. A massive, high-momentum bearish candle—highlighted by the vertical yellow marker—shows a sharp spike in selling pressure, likely triggered by a high-impact macroeconomic data release or an institutional liquidity sweep.
However, price action dynamics shift rapidly at the bottom. The extended lower wick on that breakdown candle indicates robust buying interest at the 1.14500 psychological level. Sellers were aggressively trapped as demand flooded the market, leading to a sharp V-shaped reversal. The subsequent aggressive green candles confirm that bulls have reassumed control in the short term, driving the exchange rate back toward the 1.15450 region. While the broader daily structure may still face bearish headwinds, the immediate H1 momentum is firmly hands-off to the buyers.
Mastering Forex Volatility with Expert Trading Tools
Navigating fast-moving currency pairs like the Euro and the US Dollar requires precision timing and institutional-grade analytics. Retail traders often get caught on the wrong side of high-momentum spikes because they lack real-time volume insight and automated structural mapping. To capitalize on volatile setups—like the sharp liquidity hunt shown in the H1 chart—implementing automated indicators is paramount.
Advanced trading scripts and automated software remove psychological bias from technical analysis. By automatically plotting key support/resistance levels, detecting candlestick exhaustion wicks, and flagging institutional order blocks, these tools allow traders to execute entries with minimal drawdown. Instead of manually guessing whether a massive drop is a genuine breakout or a bear trap, algorithmic tools analyze historical data models to provide high-probability buy and sell signals instantly.
Integrating a dedicated technical analysis plugin into your trading platform optimizes your workflow, refines risk-to-reward ratios, and ensures you capture explosive market reversals before they materialize on standard retail charts.
2 Downloads
Last Update:
May 20, 2026 15:32 PM
Published:
Jan 18, 2026 19:36 PM
Category: