Navigating Intraday Floor Targets: Trading Structural Reversals with Daily Pivot Points
In the fast-moving arena of intraday currency and CFD trading, establishing mechanical reference zones before the trading session starts is vital. On lower and intermediate timeframes like the 30-minute (M30) chart, day traders constantly face sudden price swings, deceptive liquidity sweeps, and volatile corrections. Without an automated, mathematically anchored floor blueprint, retail traders frequently execute entries right into heavy institutional supply zones or short into major support floors. To filter out random market noise and navigate daily price expansions with complete confidence, professional traders deploy the Daily Pivot Points indicator.
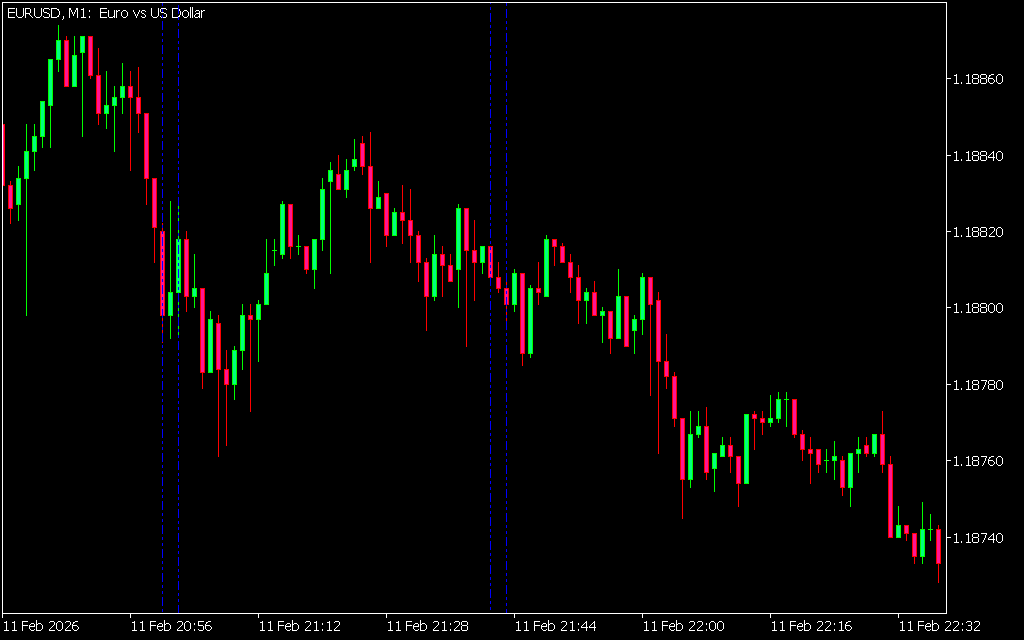
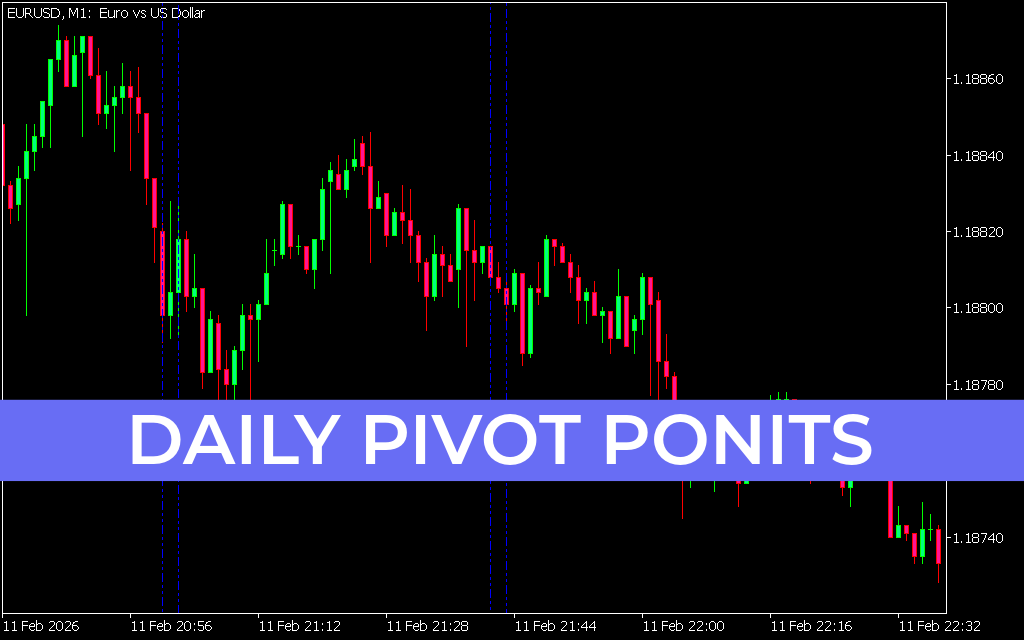
A close technical look at the EUR/USD M30 price delivery reveals a beautifully structured institutional markdown and stabilization phase. The asset coordinates an aggressive directional decline, steadily slipping past historical levels to hunt out raw sell-stop liquidity pools. This heavy distribution drive eventually drops the exchange rate down to a precise structural bottom near the 1.15860 region. Following this intensive selling climax, aggressive buying volume enters the terminal, stabilizing the pair and initiating a steady V-shaped recovery block back toward 1.16013. Anticipating and capitalizing on these sharp intraday structural boundaries requires a systematic mathematical matrix.
The Mathematics of Classic Floor Pivot Matrices
Unlike lagging, moving average-based tracking indicators that warp during sharp market moves, the Daily Pivot Points indicator uses fixed mathematical formulas. By factoring in the previous trading day's exact high, low, and closing values, the software calculates a central equilibrium line along with parallel Support And Resistance zones:
- The Central Pivot Point (PP Ceiling/Floor): This functions as the core structural center of the day. Trading above this level alerts day traders to a dominant bullish market bias, while trading below it indicates sustained seller control.
- Objective Resistance Boundaries (R1, R2, R3): Projected as crisp, horizontal reference lines across your chart layout, these levels represent historical distribution pools. They give traders highly accurate targets to take profits on long positions or watch for bearish reversal Candlestick Patterns.
- Objective Support Floors (S1, S2, S3): As beautifully demonstrated near the 1.15860 structural base, the indicator projects major support boundaries right at the key market floor. When the markdown hits these zones and shows clear candlestick rejection tails, it provides an objective, high-probability long execution trigger.
Streamlining Platform Performance and Risk Containment
The difference between elite market participants and amateur retail traders comes down to operational efficiency and the removal of emotional guesswork. Automating your floor tracking with an advanced daily calculator replaces subjective line drawing with disciplined execution rules.
The Daily Pivot Points script features a highly optimized backend configuration, ensuring smooth real-time plot calculations across your MetaTrader charts without causing performance lag or workspace drag. The fully customizable parameters panel allows you to select alternative mathematical variations (such as Standard, Fibonacci, or Camarilla calculations) and fine-tune line designs to match your template. Integrating this robust script into your routine provides the visual clarity needed to survive retail traps, align with institutional liquidity pools, and manage equity with complete precision.
1 Download
Last Update:
May 20, 2026 17:05 PM
Published:
Jan 18, 2026 14:36 PM
Category: