Precision Trading with the NTRT Indicator
In the competitive landscape of Forex trading, having a visual edge that simplifies Market Structure is vital for consistent success. The NTRT Indicator is a premier technical analysis tool designed for MetaTrader platforms that specializes in identifying dynamic Support And Resistance zones. By visualizing price exhaustion and potential reversal points, this indicator provides traders with a clear roadmap for navigating volatile currency pairs.
What is the NTRT Indicator?
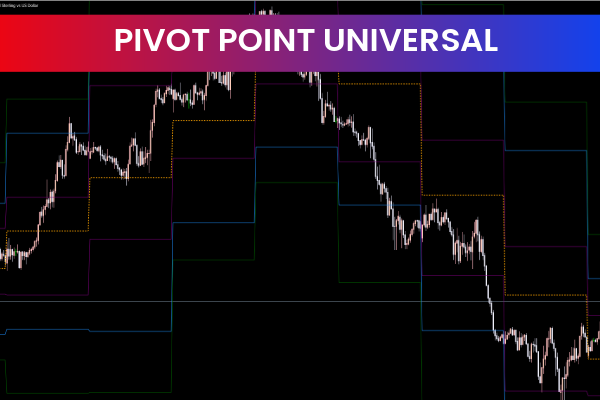
The NTRT Indicator is a trend-following and reversal tool that uses a sophisticated algorithm to plot horizontal dotted lines across the price chart. These lines represent historical price "sticky points" where the market has previously shown significant buying or selling interest. Unlike standard pivot points or static Fibonacci levels, the NTRT levels adapt to recent Price Action, making it an essential tool for Forex trading strategies focused on precision.
Key Features and Strategic Advantages
- Dynamic Level Identification: The indicator automatically identifies and plots key levels of interest, reducing the manual workload for technical analysts.
- Color-Coded Visuals: Using blue and red dotted lines, the indicator differentiates between bullish support (blue) and bearish resistance (red) zones.
- Exhaustion Detection: When price moves significantly away from a cluster of NTRT lines, it often signals exhaustion, alerting traders to a potential mean-reversion opportunity.
- Scalping Optimization: Due to its sensitivity to price shifts, it is a highly effective tool for 5 minutes scalping and fast-paced day trading.
Practical Application and Trading Insights
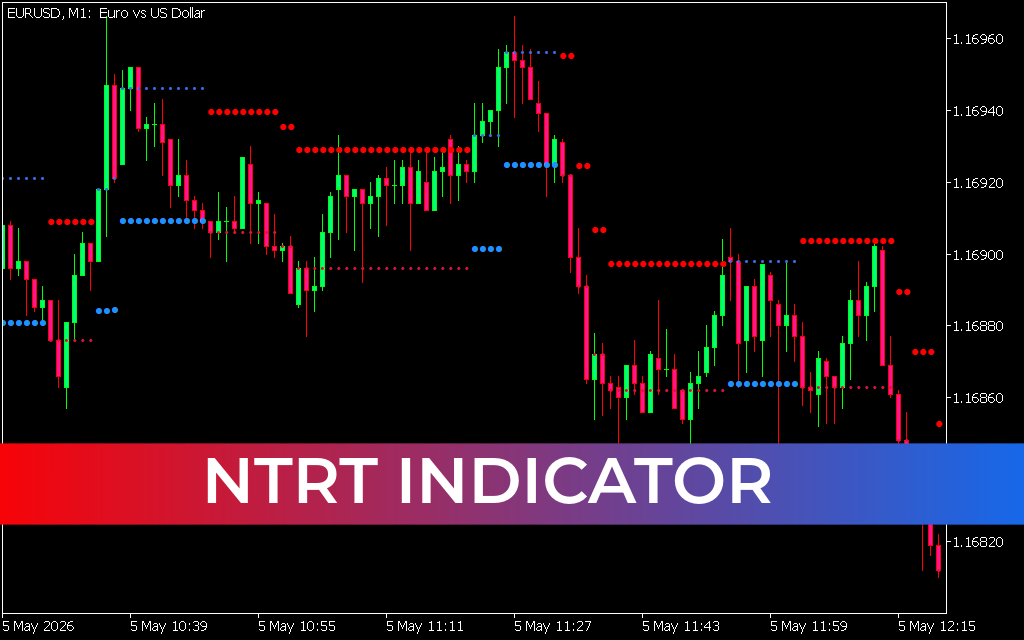
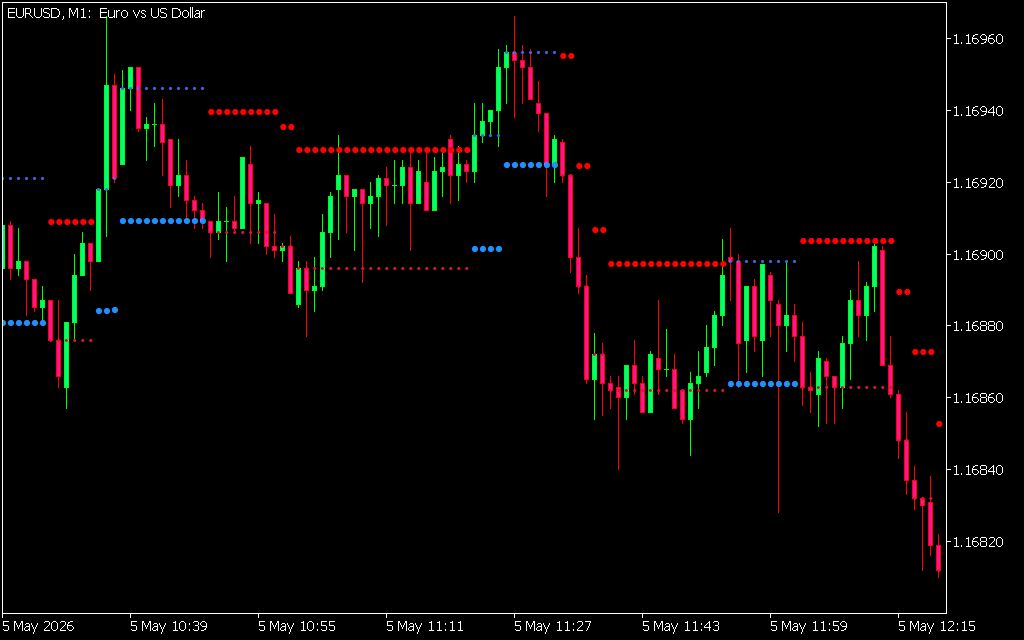
As demonstrated in the file EURUSDM1.png, the NTRT Indicator creates a grid-like structure on the chart. Traders can use these levels in several high-probability ways:
- Breakout Confirmation: If price breaks through a red resistance line with high volume, it signals a strong bullish continuation.
- Rejection Trading: When price touches a blue support line and forms a bullish candlestick pattern (like a pin bar), it provides a low-risk entry for a long position.
- Trailing Stop Placement: The dotted lines act as logical "safe zones" for placing stop-loss orders. As the trend progresses, traders can trail their stops behind new NTRT levels to lock in profits.
Why You Need the NTRT Indicator
Most retail traders struggle with "blind trading"—entering positions based on gut feeling rather than objective data. The NTRT Indicator removes the guesswork. It highlights exactly where the market is likely to stall or reverse, allowing you to align your trades with the path of least resistance. Whether you are a professional focused on momentum trading or a beginner learning price action, this indicator provides the structural clarity needed to scale your trading account.
6 Downloads
Last Update:
May 05, 2026 17:53 PM
Published:
Jan 27, 2026 19:10 PM
Category: