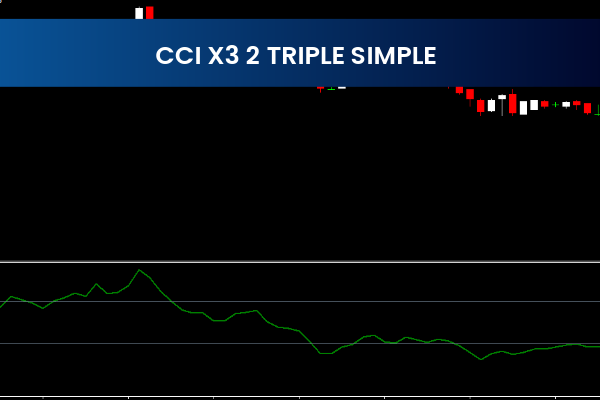
The CCI X3 2 Triple Simple Indicator is a useful and popular free Forex Indicator designed specifically for the MT4 trading platform. Built on the widely used Commodity Channel Index (CCI), this indicator helps traders identify market trends, overbought and oversold conditions, and potential buy and sell opportunities with clarity and precision. Whether you are a beginner or an experienced trader, this indicator offers a simple yet effective way to enhance technical analysis.
Understanding the CCI X3 2 Triple Simple Indicator
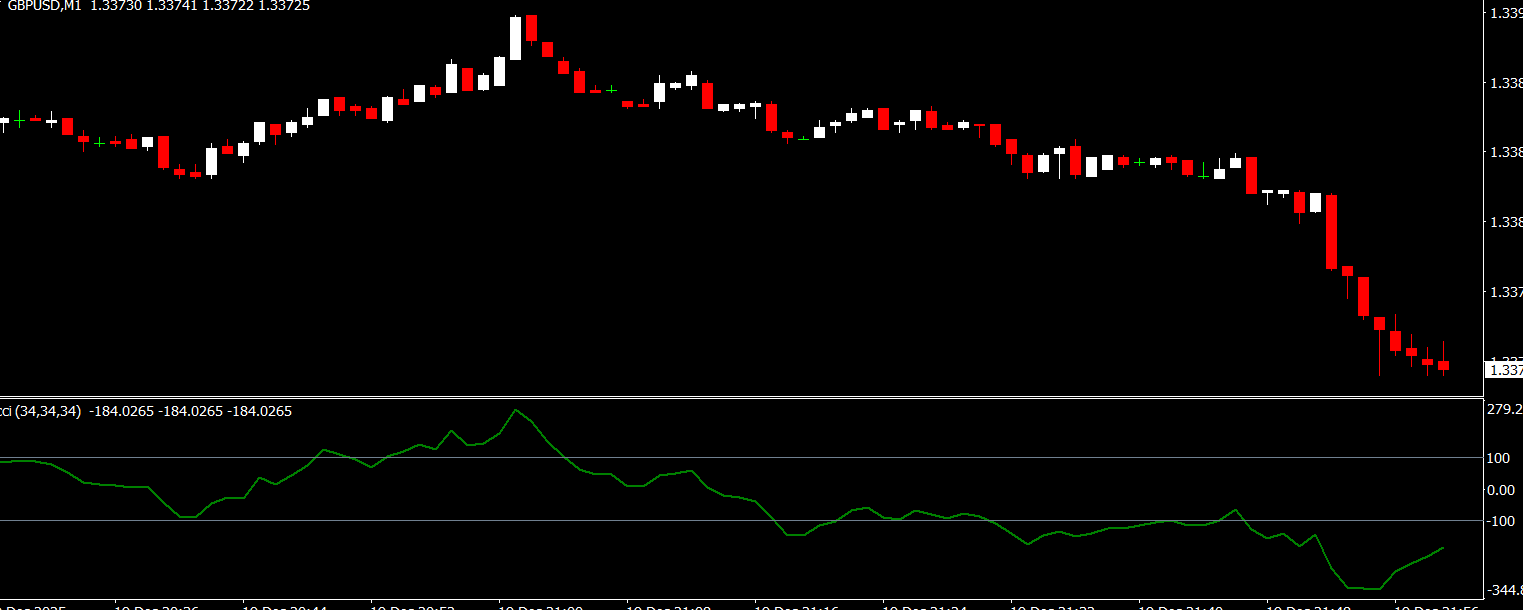
The CCI X3 2 Triple Simple Indicator works by plotting three distinct lines directly on the chart. The primary line is the standard CCI line, which is calculated using the average of the high, low, and closing prices over the last 14 periods. This calculation allows traders to measure price deviation from its statistical mean, making it easier to spot Trend Strength and reversals.
The remaining two lines represent fixed overbought and oversold levels, set at +100 and -100. These levels act as visual thresholds that help traders quickly evaluate whether the market is stretched beyond normal price behavior.
How the Indicator Generates Trading Signals
Trading signals from the CCI X3 2 Triple Simple Indicator are straightforward and easy to interpret.
Buy Signal Logic
When the CCI line crosses above the -100 level and moves upward, it often signals that bearish pressure is weakening and bullish momentum may begin. Traders commonly interpret this move as a potential buy opportunity, especially when supported by other technical tools.
Sell Signal Logic
A sell signal occurs when the CCI line crosses below the +100 level and starts moving downward. This behavior suggests that the market may be overbought and a bearish reversal could be approaching.
Because the signals are visually clear, this indicator is especially useful for traders who prefer clean and uncluttered charts.
Identifying Market Trends with Accuracy
One of the major strengths of the CCI X3 2 Triple Simple Indicator is its ability to identify market trends. When the CCI line remains above the zero level, it generally indicates bullish market conditions. Conversely, when it stays below zero, bearish momentum is dominant.
Trend traders often use this behavior to stay aligned with the overall market direction and avoid low-probability countertrend trades.
Overbought and Oversold Market Conditions
The overbought and oversold levels are critical components of this indicator. When the CCI line moves above +100, the market may be overbought, signaling caution for buyers. When it drops below -100, the market may be oversold, potentially presenting buying opportunities.
These levels help traders avoid emotional decisions and instead rely on structured technical signals.
Best Trading Strategies Using the Indicator
The CCI X3 2 Triple Simple Indicator works best when combined with other technical analysis tools such as Support And Resistance levels, moving averages, or candlestick patterns. Traders often use it for:
Trend confirmation
Entry and exit timing
Momentum-based strategies
Scalping and intraday trading
Using multiple confirmations can significantly improve accuracy and reduce false signals.
Why MT4 Traders Prefer This Indicator
MT4 traders appreciate this indicator for its simplicity, reliability, and effectiveness. It does not repaint, is easy to install, and performs well across multiple timeframes and currency pairs. Because it is free and lightweight, it is an excellent addition to any MT4 indicator collection.
Final Thoughts and Recommendation
The CCI X3 2 Triple Simple Indicator is a powerful yet easy-to-use technical tool that helps traders identify trends, overbought and oversold zones, and potential buy and sell signals. Its clean design and logical signal structure make it suitable for both new and advanced traders.
For more high-quality MT4 indicators, trading tools, and strategies, visit IndicatorForest.com and enhance your Forex trading performance today.
FAQ
1 Download
Published:
Dec 21, 2025 00:41 AM
Category: