Precision Trend Analysis with the Chande Qstick Indicator
In the pursuit of market mastery, many traders overlook the most basic yet profound data point on their charts: the relationship between the open and close of a candle. While standard moving averages smooth out Price Action over long periods, they often fail to capture the immediate internal strength of individual sessions. The Chande Qstick Indicator is a unique momentum oscillator designed to quantify this "buying or selling pressure" by calculating a moving average of the difference between the closing and opening prices.
The Logic Behind Qstick
Developed by Tushar Chande, the Qstick is remarkably simple in its construction but powerful in its execution. At its core, it seeks to answer a single question: Are the bulls or the bears winning the intraday battle?
- When the close is higher than the open (a green or white candle), the session shows buying pressure.
- When the close is lower than the open (a red or black candle), it indicates selling pressure.
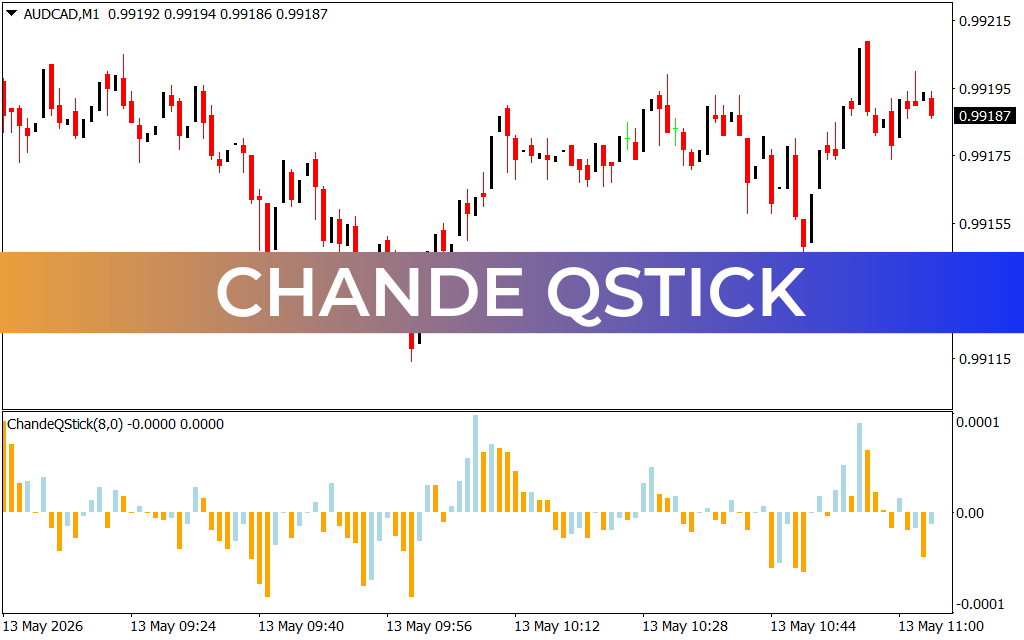
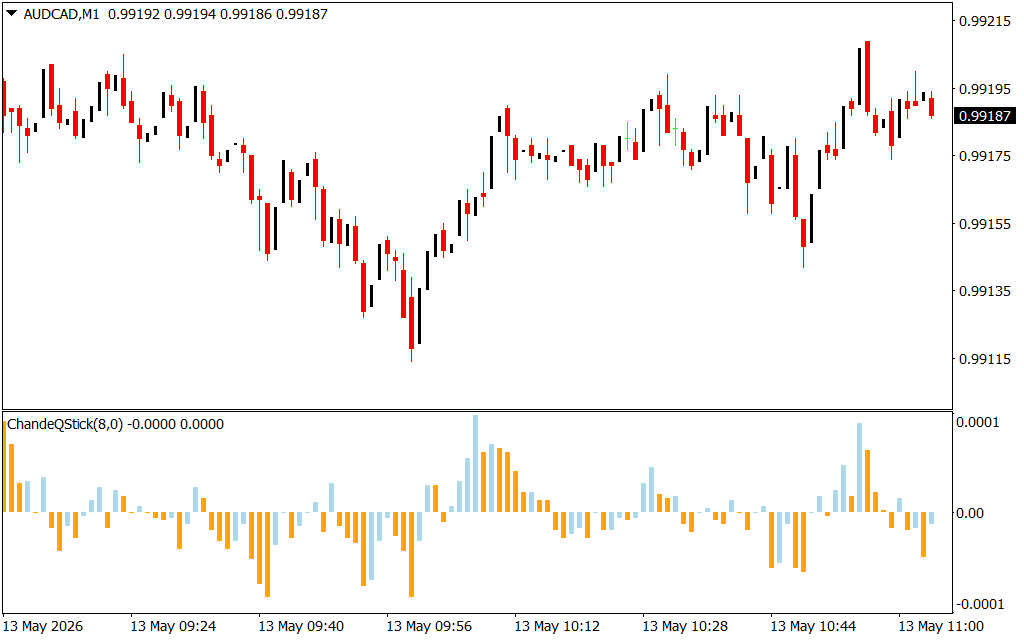
By taking a simple moving average of these differences, the Chande Qstick transforms erratic candlestick patterns into a smooth, readable histogram. As seen on the AUDCAD M1 chart, this allows scalpers and day traders to see the underlying trend through the "noise" of a single minute's price action.
Key Trading Signals
The Chande Qstick is a versatile tool that can be integrated into various trading strategies. Its visual representation—typically shown as bars above and below a zero line—provides three primary types of signals:
- Zero-Line Crossovers: The most common signal occurs when the Qstick crosses the zero line. A move above zero suggests that buying pressure is becoming dominant, signaling a potential long entry. Conversely, a drop below the zero line indicates that selling pressure is taking over.
- Divergence: Just like the MACD or RSI, the Qstick can reveal hidden reversals. If price makes a new high but the Qstick histogram shows a lower peak, it suggests that the bulls are losing momentum despite the higher price, warning of an impending correction.
- Extreme Readings: In the provided image, we can see the histogram bars turn orange during periods of intensified momentum. These extreme "spikes" help traders identify overextended markets where a mean-reversion move might be likely.
Why Scalpers Love the Chande Qstick
For high-frequency traders working on 1-minute timeframes, the Chande Qstick is invaluable. Because it focuses on the internal body of the candle rather than the "wicks" or highs/lows, it provides a purer sense of conviction. In the AUDCAD example, the indicator accurately reflects the shifting sentiment during a choppy session, helping the trader avoid low-conviction entries during periods of indecision.
Conclusion
The Chande Qstick is an elegant solution for traders who want to move beyond basic price observation. By mathematically smoothing out candlestick sentiment, it offers a clear, objective view of who is truly in control of the market. Whether you are using it to confirm a trend or spot a reversal, the Chande Qstick is a fundamental addition to any professional technical analysis toolkit.
11 Downloads
Last Update:
May 13, 2026 14:06 PM
Published:
Jan 23, 2026 01:38 AM
Category: