Revolutionize Your Trend Analysis with the Channels Fibo AD Indicator
In the complex world of technical analysis, finding a balance between trend identification and price exhaustion levels is key to sustainable profitability. The Channels Fibo AD Indicator is a sophisticated trading tool that bridges this gap by combining dynamic price channels with the mathematical precision of Fibonacci retracement levels. Designed for the MetaTrader platform, this indicator provides a multi-layered roadmap that helps traders visualize where a trend is going and, more importantly, where it is likely to stall or reverse.
The Science Behind Channels Fibo AD
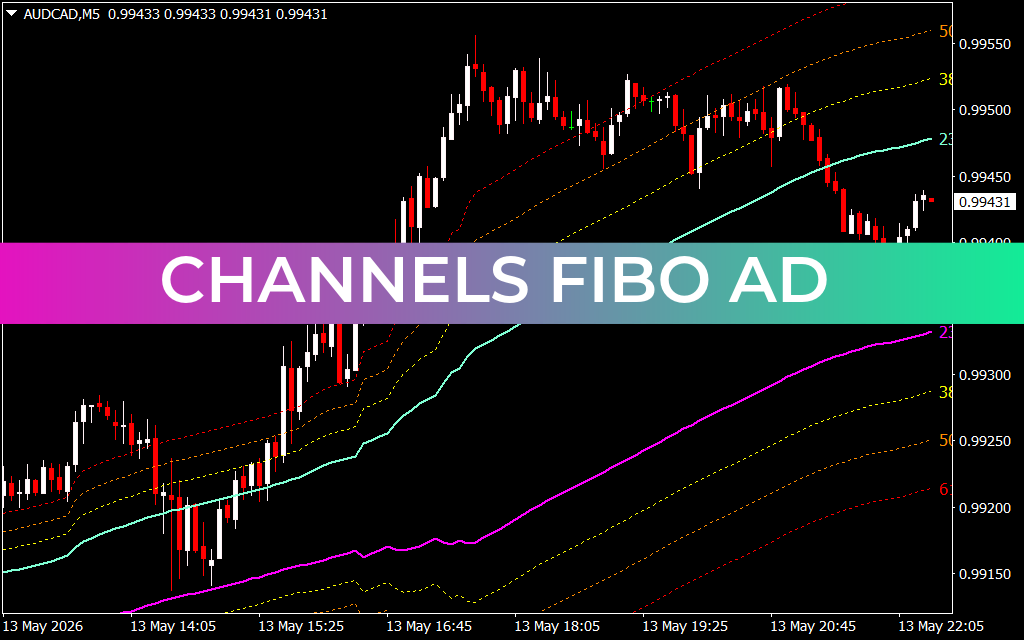
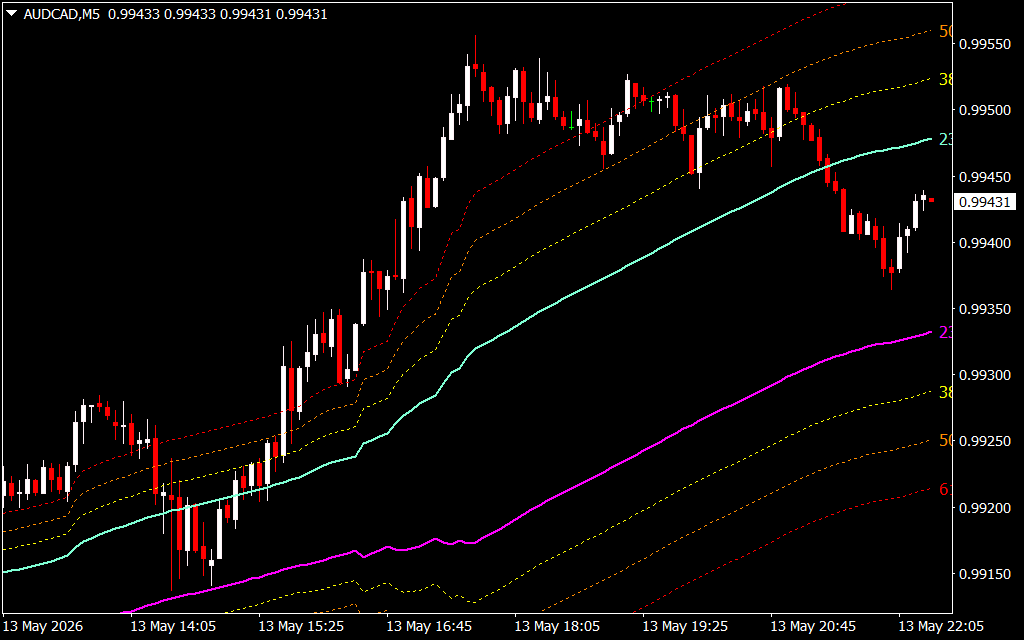
The Channels Fibo AD indicator is not just a simple moving average envelope. It utilizes a core "AD" (Average Directional) calculation to establish a central trend line and then projects multiple outer bands based on Fibonacci ratios (such as 23.6, 38.2, 50.0, and 61.8). As seen in the AUD/CAD M5 chart, these bands create a comprehensive "trading corridor" that expands and contracts based on market volatility.
When price action is aggressive, the bands widen to encompass the volatility. When the market consolidates, the bands tighten, signaling an impending breakout. By using Fibonacci ratios for the channel spacing, the indicator identifies natural "hidden" Support And Resistance levels that standard linear channels often miss.
Key Trading Advantages
- Institutional Price Levels: Fibonacci levels are widely used by institutional banks and hedge funds. By overlaying these on a dynamic channel, the Channels Fibo AD reveals where "big money" is likely to take profits or enter new positions.
- Overextended Market Detection: The outer Fibonacci bands (50.0 and 61.8) act as exhaustion zones. If the price touches or pierces these outer boundaries, it suggests the market is overbought or oversold, providing a high-probability signal for mean-reversion trades.
- Trend Strength Visualization: The slope of the central channel lines provides an immediate read on trend direction. On the 5-minute chart, a steep upward slope indicates strong intraday bullish momentum, allowing scalpers to stay aligned with the primary flow.
- Precise Stop Loss Placement: Traders can use the various Fibonacci levels to trail their stop losses effectively. Moving a stop loss behind a specific Fibonacci band (like the 23.6 or 38.2 level) ensures that you lock in profits while giving the trade enough "room to breathe."
Scalping and Day Trading Applications
While effective on all timeframes, the Channels Fibo AD shines on lower timeframes like the M1 and M5. For a scalper, the indicator provides a clear "Buy low, Sell high" framework within the channel. In a bullish trend, a trader would look for the price to dip toward the lower Fibonacci levels (the "support" side of the channel) before entering a long position, targeting the upper bands as a primary objective.
Conclusion
The Channels Fibo AD indicator is an essential asset for any trader who relies on structural analysis. By merging trend-following logic with Fibonacci mathematics, it offers a level of market depth that few other indicators can match. Whether you are a swing trader looking for major reversals or a scalper hunting for intraday volatility, this tool provides the clarity needed to navigate the markets with confidence.
6 Downloads
Last Update:
May 14, 2026 01:26 AM
Published:
Jan 23, 2026 00:24 AM
Category: