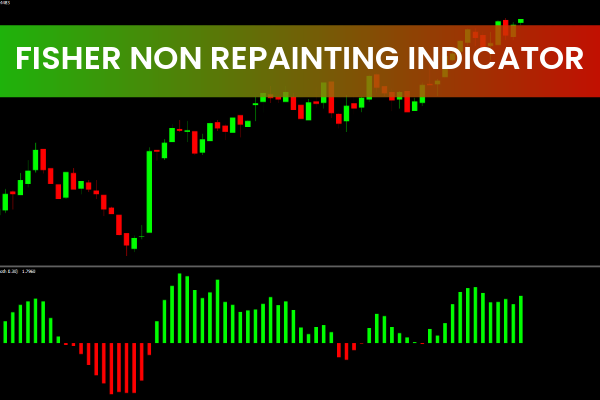
The Fisher No Repainting Indicator is an upgraded version of John F. Ehlers’ famous Fisher Transform. Ehlers designed the Fisher Transform to reduce lag and highlight price reversals more clearly. This non-repainting version enhances the concept further by keeping all historical signals fixed, making it more reliable for live trading.
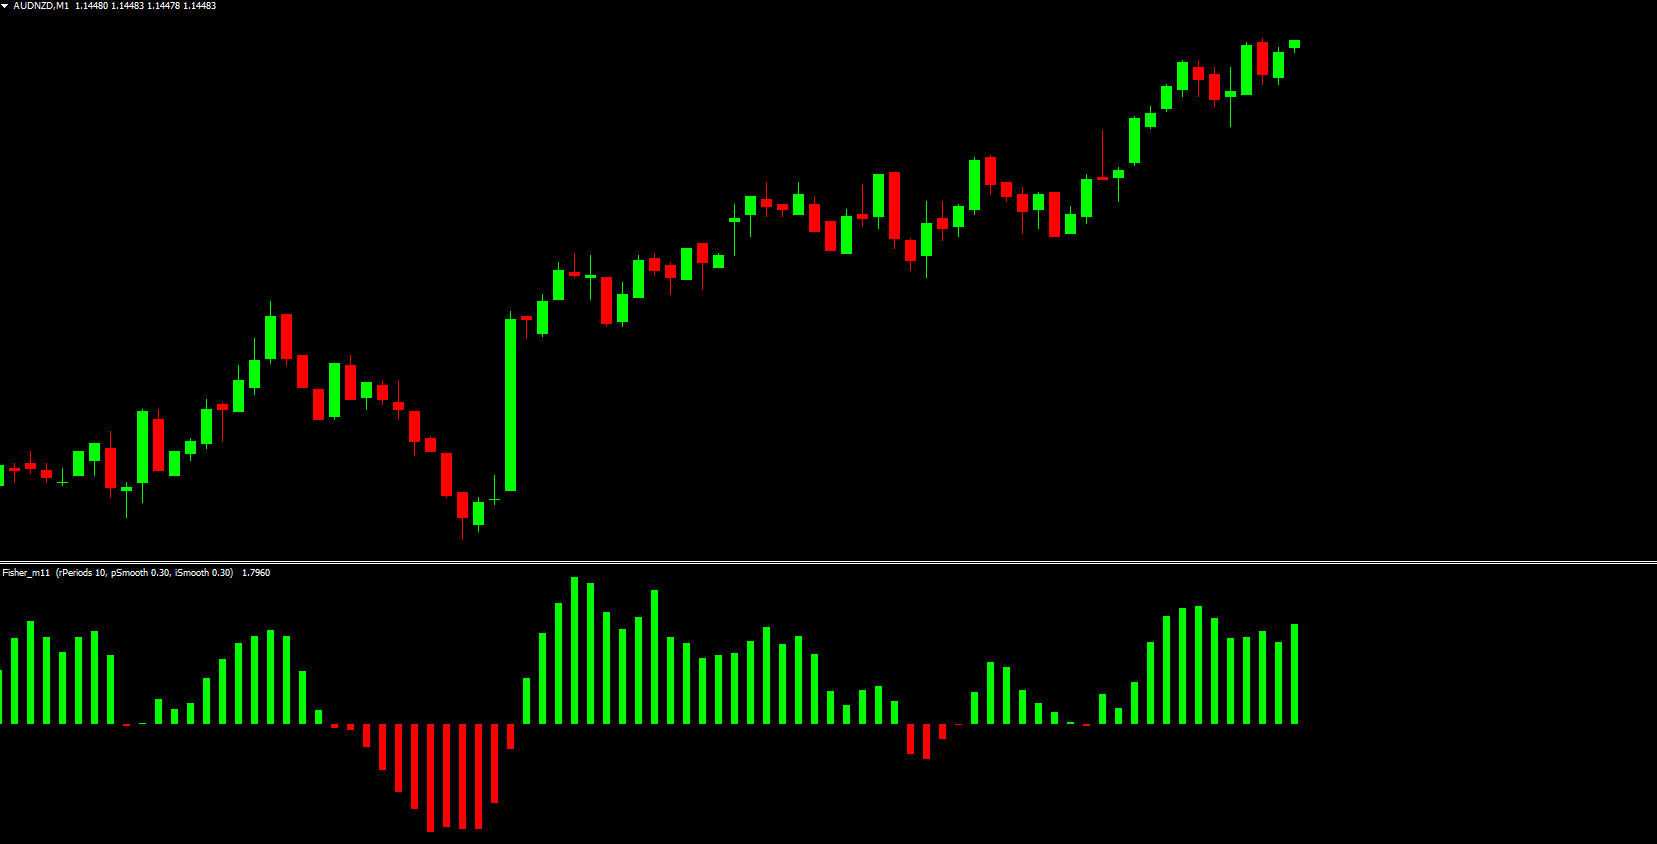
Displayed in a separate window as a histogram, the indicator uses:
Green bars → Bullish trend
Red bars → Bearish trend
Traders favor it for spotting early trend changes, often before moving averages react.
How the Fisher No Repainting Indicator Works
The histogram fluctuates around a zero line, creating easy-to-read trend signals:
BUY Conditions
Histogram turns green
Bars rise above 0
Trend momentum increases
SELL Conditions
Histogram turns red
Bars fall below 0
Downward momentum strengthens
Zero-Line Break Signals
Crossing UP through zero → BUY
Crossing DOWN through zero → SELL
These zero-line breaks often precede strong directional moves.
Timeframes and Best Practices
Works on all timeframes
Best on H1, H4, and Daily to avoid noise
Combine with RSI, MACD, or SuperTrend for confirmation
Because it doesn’t repaint, traders can rely on the signals for trend continuation or reversal setups.
Does the Fisher Indicator Repaint?
This version is the Fisher No Repainting Indicator, meaning:
It does not repaint past bars
It updates only the current candle
Historical signals remain unchanged and reliable
Best Non-Repainting Indicators
Some of the most trusted non-repainting indicators include:
RSI
Fibonacci Levels
Bollinger Bands
Moving Averages
Fisher No Repainting Indicator
Conclusion
The Fisher No Repainting Indicator provides clear BUY/SELL signals using a simple histogram format.
Because it never changes historical values, traders can trust its signals for:
Trend reversals
Momentum shifts
It is free to download and works on any MT4 chart, making it a valuable addition to any trading strategy.
FAQ
9 Downloads
Published:
Nov 26, 2025 02:46 AM
Category: