The Level Trading 123 MT4 Indicator is a popular and free Forex tool designed to help traders identify bullish and bearish trend levels on price charts. By using fractals, the indicator allows traders to spot higher highs (HH), higher lows (HL), lower lows (LL), and lower highs (LH) during a trend, making it easier to understand Market Structure and potential reversal points.
This indicator is highly beneficial for both beginner and advanced Forex traders, as it provides visual cues for trend direction, Support And Resistance levels, and potential entry and exit points.
How the Level Trading 123 MT4 Indicator Works
The indicator operates using fractals to detect the beginning and end of price movements:
In an uptrend, price forms waves of HH and HL
In a downtrend, price forms waves of LL and LH
A break of this structure signals a potential trend reversal
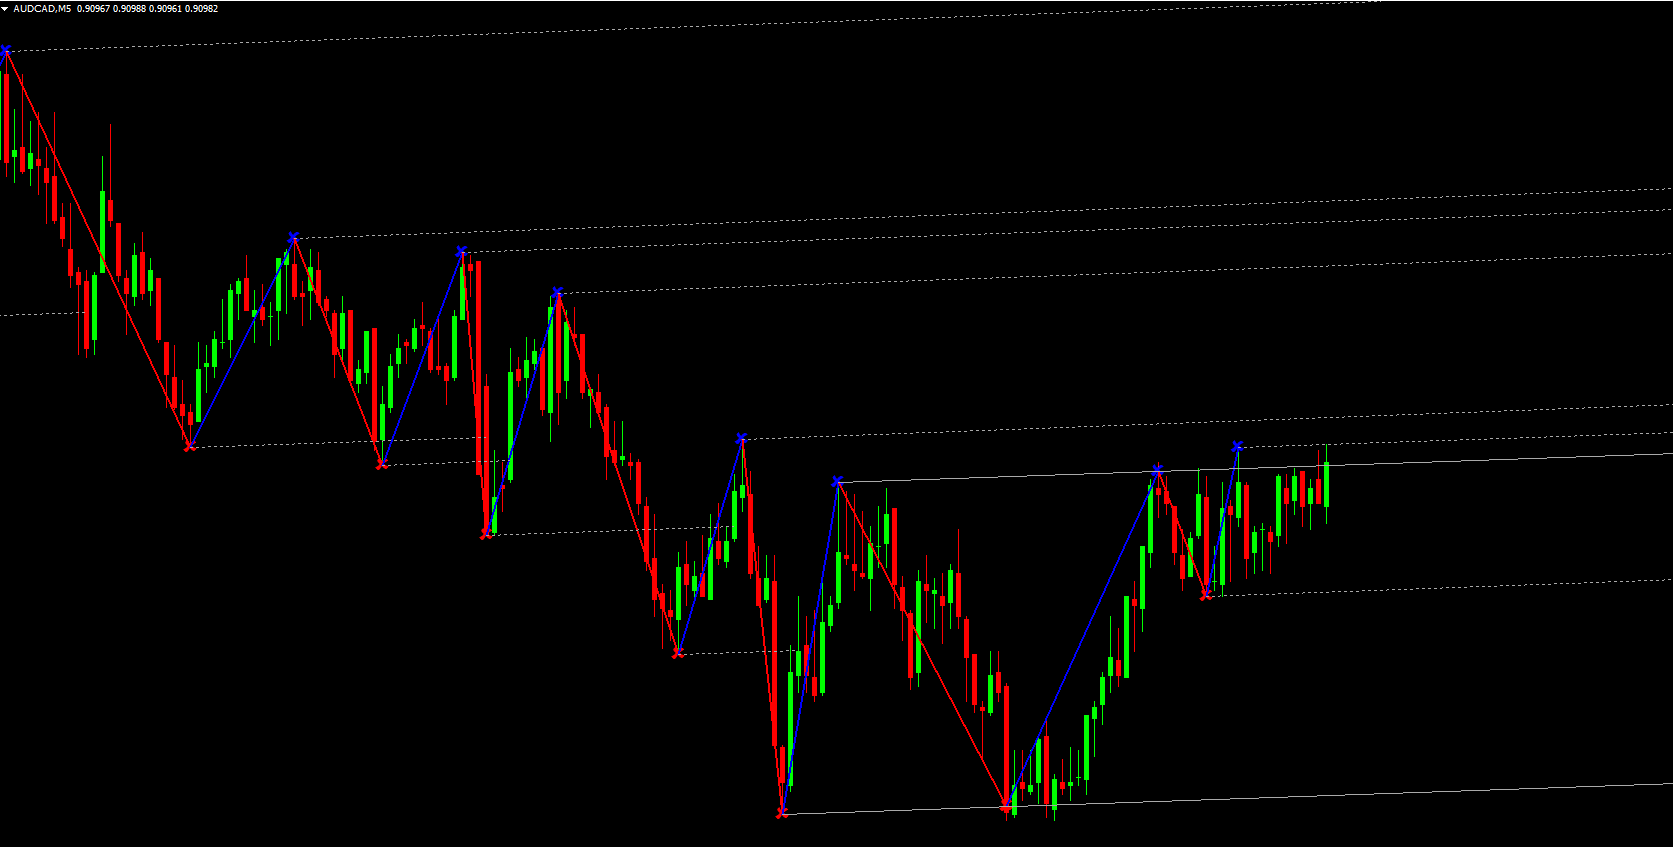
The indicator visually represents these trends using colored lines and symbols:
Blue line: Uptrend
Red line: Downtrend
Gray line: Level lines for support and resistance
Blue X: Bullish exit signal
Red X: Bearish exit signal
These visual tools make it easier to identify trend direction and plan trades accordingly.
Key Features of the Level Trading 123 MT4 Indicator
The Level Trading 123 MT4 Indicator includes several features that make it a practical tool for MT4 traders:
Uses fractals to identify bullish and bearish trends
Plots trend lines (blue for uptrend, red for downtrend)
Marks exit signals with X symbols (blue for bullish, red for bearish)
Plots support and resistance levels with gray lines
Helps traders spot trend reversals early
Works on all MT4 timeframes and currency pairs
Free and easy to install on MT4
These features allow traders to visually track market trends, determine optimal entry and exit points, and improve trade planning.
Benefits of Using the Level Trading 123 MT4 Indicator
The Level Trading 123 MT4 Indicator provides several advantages for Forex traders:
Helps identify trend direction using HH, HL, LL, and LH levels
Provides early signals of potential trend reversals
Highlights support and resistance zones for stop-loss and take-profit planning
Reduces guesswork by visually plotting trend levels and exit signals
Suitable for Scalping, day trading, and swing trading
By using this indicator, traders can anticipate market movements and make informed trading decisions based on the structure of price waves.
How Traders Can Use the Level Trading 123 MT4 Indicator Effectively
To use the Level Trading 123 MT4 Indicator effectively:
Enter long trades when the indicator confirms an uptrend with HH and HL
Enter short trades when the indicator confirms a downtrend with LL and LH
Use exit signals (X markers) to close trades at optimal points
Monitor level lines for potential support and resistance
Combine with other technical indicators such as moving averages or oscillators for confirmation
This approach allows traders to maximize trend-following opportunities and minimize risk during trend reversals.
Why the Level Trading 123 MT4 Indicator Is Popular
The Level Trading 123 MT4 Indicator is widely used because it simplifies trend analysis and provides actionable insights into market structure. Its visual representation of HH, HL, LL, and LH levels makes it easier for traders to understand trends and plan trades effectively.
Overall, the Level Trading 123 MT4 Indicator is a valuable MT4 tool for Forex traders looking to track trends, spot reversals early, and improve overall trading performance.
Download the Level Trading 123 MT4 Indicator today from IndicatorForest.com and enhance your Forex trading strategy with clear trend and reversal signals.
FAQ
Level Trading 123 uses fractals to label higher highs, higher lows, lower highs and lower lows, visually mapping the trend structure. It also draws colored trend and level lines along with X markers for suggested exits.
In an uptrend you typically see HH and HL sequences, while a downtrend shows LL and LH. A break in this sequence often signals a potential trend change, helping you adjust your bias or manage existing trades.
Blue Xs generally indicate suggested exits for bullish positions, and red Xs do the same for bearish ones. They mark points where the underlying wave structure suggests that the existing move may be ending.
It can be applied to any timeframe, but higher charts like H1 and above often provide clearer wave structure. Lower timeframes can be used if you are comfortable dealing with more frequent swings.
Use Level Trading 123 to understand structure, then add tools like moving averages, RSI or support and resistance to confirm entries and manage risk. Structure plus confirmation generally leads to stronger setups.
4 Downloads
Published:
Dec 18, 2025 02:05 AM
Category: