Unlock Market Geometry with the FibMark Indicator
In the world of professional technical analysis, few tools carry as much weight as Fibonacci ratios. Based on the mathematical sequences found throughout nature and financial markets, these levels represent the "hidden" structure of Price Action. However, manually drawing Fibonacci fans or retracements can be subjective and time-consuming. The FibMark Indicator for MetaTrader 4 (MT4) automates this process, ensuring you always have objective, high-probability levels on your chart.
What is the FibMark Indicator?
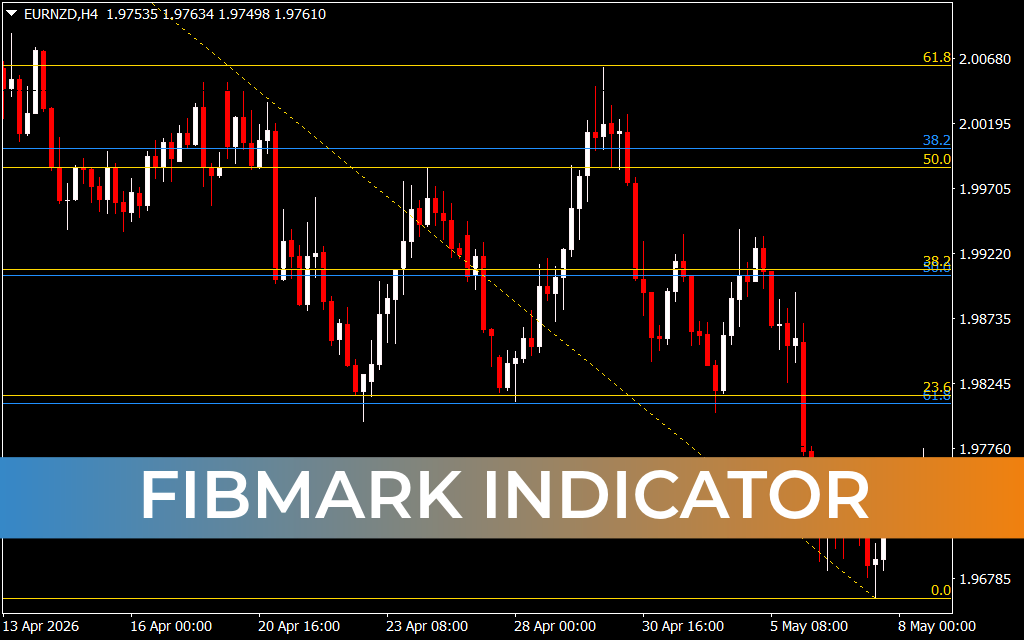
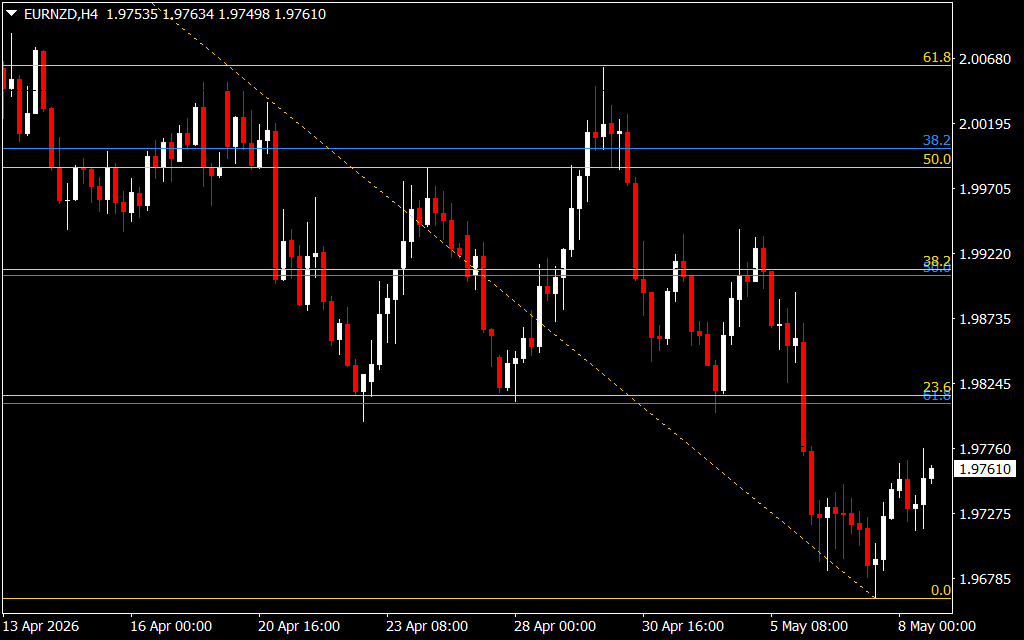
The FibMark Indicator is a sophisticated price-action utility that scans historical data to identify major structural turning points. It automatically anchors a Fibonacci grid from the most relevant swing high to the most relevant swing low. As seen on the H4 chart, the indicator plots key horizontal levels including the 23.6%, 38.2%, 50.0%, and the "Golden Ratio" 61.8% levels.
Why Traders Rely on FibMark
- Objective Structure: By automating the anchor points, FibMark removes human bias. Every trader using the indicator sees the exact same levels, leading to self-fulfilling price reactions at these coordinates.
- Dynamic Support And Resistance: Fibonacci levels act as "invisible" floors and ceilings. During a correction, price often seeks out the 50.0% or 61.8% retracement levels before resuming the primary trend.
- Precision Target Setting: For swing traders, the expansion levels provided by FibMark serve as logical take-profit zones. You can exit your trades exactly where institutional sell-side liquidity is likely to enter the market.
- Multi-Timeframe Confluence: FibMark excels when used across different timeframes. When an H4 Fibonacci level aligns perfectly with a Daily level, it creates a "High-Probability Zone" that professional traders watch closely.
Strategic Trading with Fibonacci Levels
Trading with the FibMark Indicator is about patience and confluence. As illustrated in the EURNZD example, price frequently "stalls" or consolidates at the 38.2% and 50.0% marks. A classic strategy involves waiting for price to retrace to the 61.8% level during a trend. If a bullish reversal candle (like a pin bar) forms on this "Golden" level, it provides a high-conviction entry signal with a tight stop-loss below the 0.0% anchor.
Furthermore, the FibMark Indicator is an essential tool for identifying "Deep Retracements" versus total trend reversals. If price closes convincingly below the 61.8% mark, it often signals that the prior trend has ended, allowing you to flip your bias early and avoid unnecessary losses.
9 Downloads
Last Update:
May 08, 2026 20:03 PM
Published:
Jan 25, 2026 21:24 PM
Category: