Master Market Precision with the LSMA Line Indicator
In the world of technical analysis, the quest for the "perfect" moving average is a constant battle between reducing lag and filtering out market noise. While standard Simple Moving Averages (SMA) often react too slowly to sudden price shifts, and Exponential Moving Averages (EMA) can be prone to false signals, the LSMA Line (Least Squares Moving Average) offers a mathematically superior alternative. This indicator provides traders with a "best-fit" line that predicts where price should be if the current trend remains linear, making it an essential tool for high-precision MetaTrader setups.
Download LSMA Line for free. Reduce lag and capture trends early with this professional-grade Least Squares Moving Average indicator for MetaTrader.
The Mathematics of the Least Squares Method
The LSMA, also known as an Endpoint Moving Average, is based on a linear regression calculation. Instead of simply averaging past prices, the LSMA calculates a regression line for a specific period and projects it to the current bar. This mathematical approach essentially asks: "If we draw a straight line through the last X bars, where would that line end right now?"
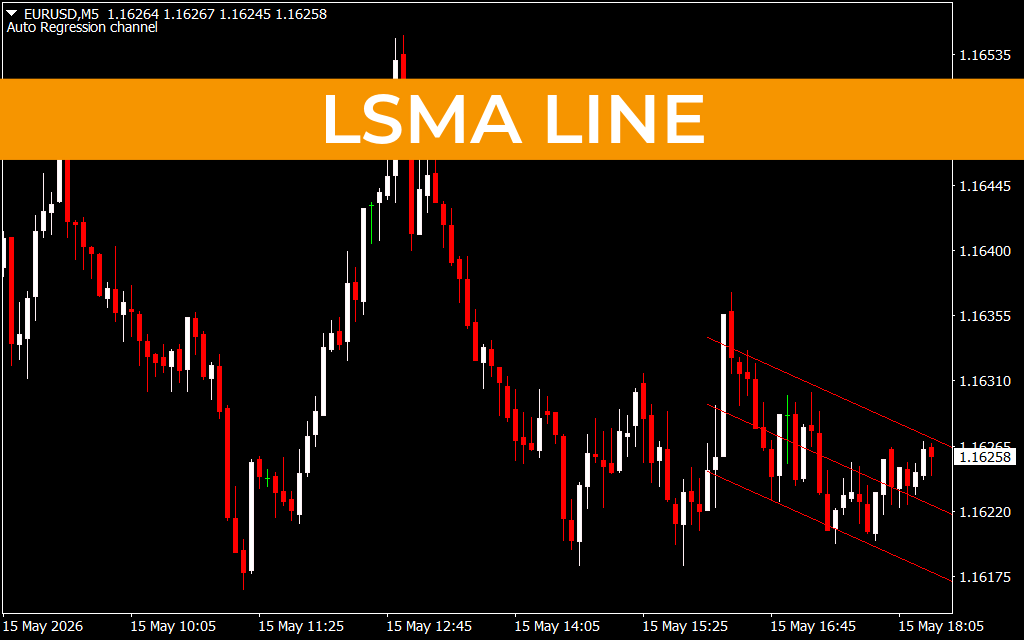
As demonstrated in the EURUSD M5 chart, the LSMA Line appears as a vibrant, color-coded overlay that hugs the Price Action far more closely than a standard moving average.
- Bullish Momentum (Blue Line): When the LSMA is sloping upward and colored blue, it indicates that the linear progression of price is positive.
- Bearish Momentum (Red Line): When the line turns red and slopes downward, it confirms that the mathematical trend has shifted toward the sellers.
- Slope Sensitivity: The primary advantage of the LSMA is its reaction speed. Because it is predictive of the "current" end of a regression line, it turns much faster than an EMA when price reverses.
Strategic Trading: Crossovers and Slope Changes
The LSMA Line is a powerhouse for traders who specialize in Scalping or momentum-based day trading. Its visual clarity allows for mechanical execution with minimal emotional interference.
- Trend-Following Core: Traders often use the LSMA color change as a primary entry signal. In the provided M5 analysis, a transition from red to blue provides an early warning of a bullish breakout, allowing traders to enter well before traditional indicators catch up.
- The LSMA-Price Crossover: A classic strategy involves watching for price to cross and close over the LSMA line. Because the LSMA acts as a dynamic "fair value" line, a candle closing above a blue LSMA suggests high-conviction buying pressure.
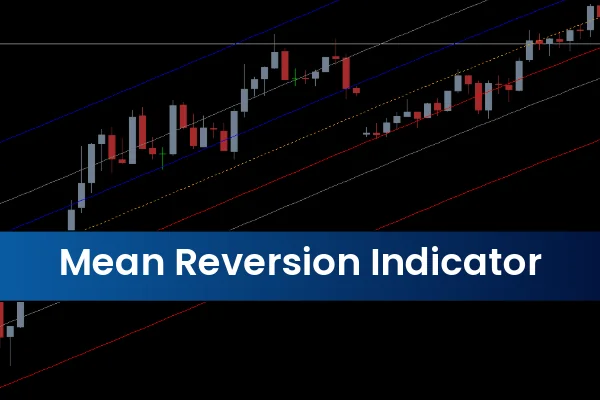
- Mean Reversion: In ranging markets, the LSMA acts as a magnet. When price extends significantly far from the line, it is considered "mathematically overextended," signaling a potential snap-back to the mean.
Why Every Professional MT4 Setup Needs the LSMA
The LSMA Line is optimized for the modern, high-speed trading environment. It is particularly effective on lower timeframes like the M1, M5, and M15, where capturing the "meat" of a move quickly is vital.
- Lag Elimination: By using linear regression rather than simple accumulation, the LSMA eliminates the "trailing" effect common in other moving averages.
- Objective Visuals: The color-coded logic (Blue for Long, Red for Short) simplifies chart reading during fast-moving sessions.
- Universal Application: Whether you are trading Forex majors, Commodities like Gold, or volatile Crypto pairs, the LSMA provides a consistent mathematical framework.
By integrating the LSMA Line into your trading arsenal, you gain a structural edge that combines the reliability of regression analysis with the speed of a momentum oscillator. Stop chasing the market and start trading with linear precision.
46 Downloads
Last Update:
May 15, 2026 21:30 PM
Published:
Jan 21, 2026 17:27 PM
Category: