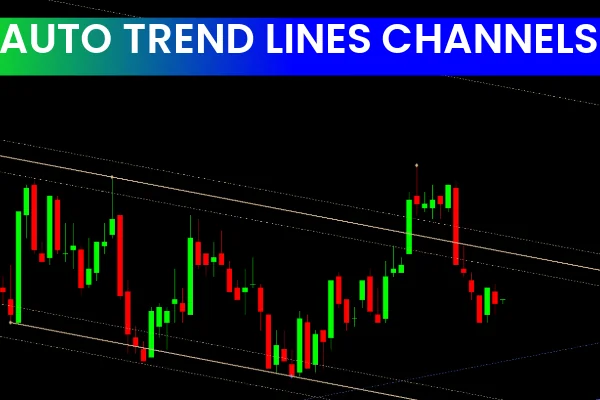
The Auto Trend Lines Channels Indicator for MT4 is a powerful technical analysis tool that automatically identifies and plots trend line channels. By analyzing the highs and lows of past Price Action, the indicator determines the market’s overall trend direction and highlights potential reversal zones. Its automation makes it suitable for scalpers, day traders, and swing traders who want precise Market Structure insights without manual chart drawing.
Features of the Auto Trend Lines Channels Indicator
Automatic Trend Line and Channel Detection
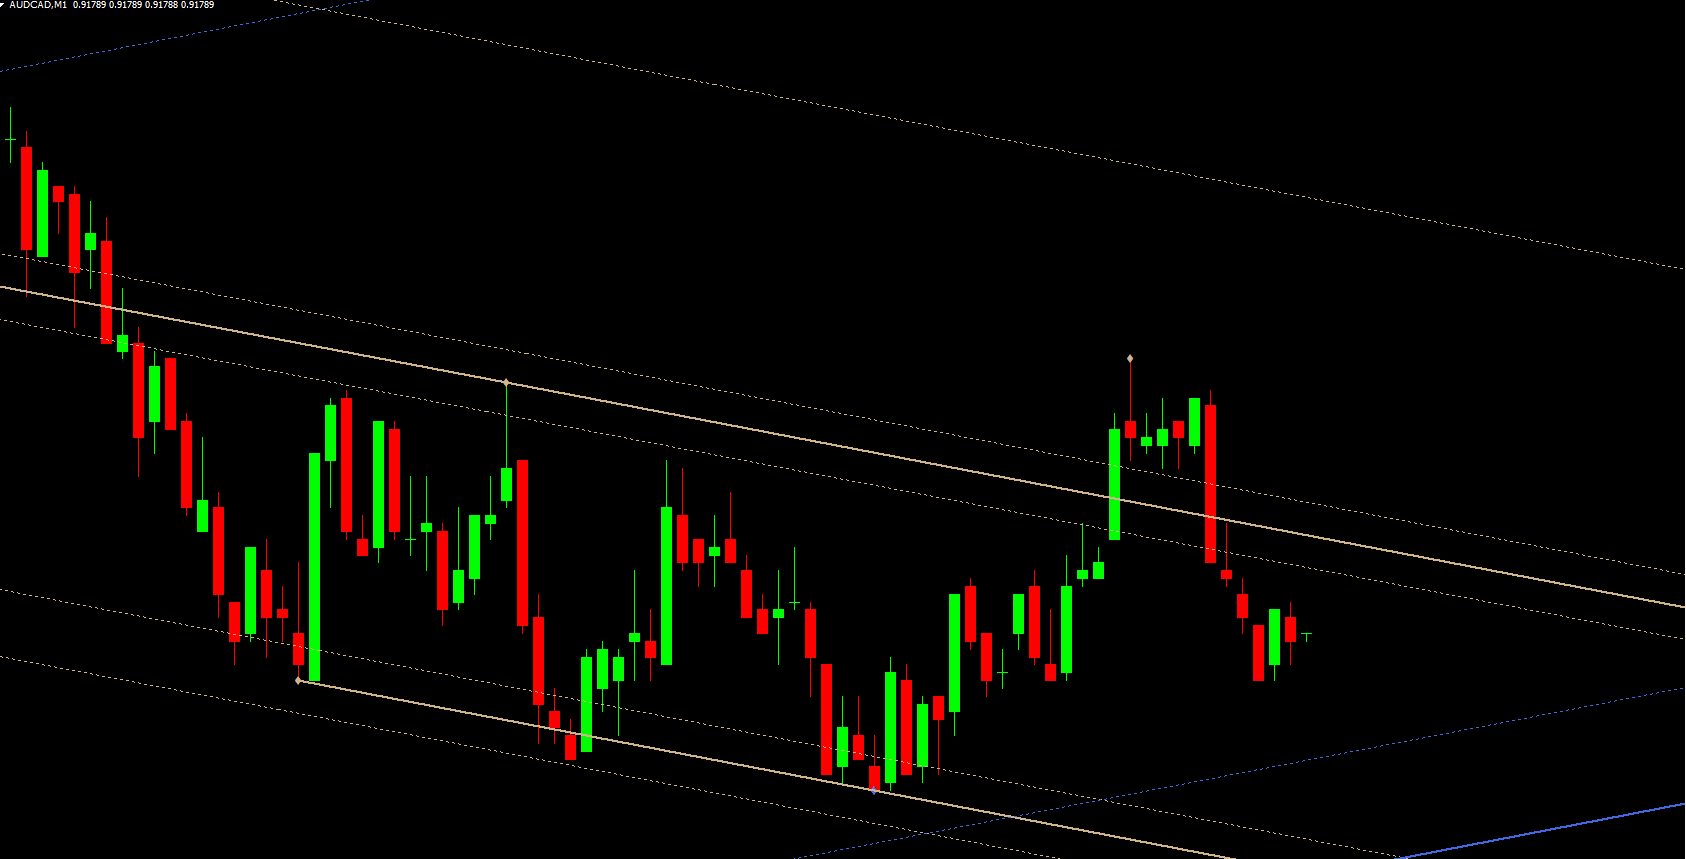
The indicator tracks price movement from zone to zone and automatically draws ascending or descending channels. These channels are built by identifying previous swing highs and lows and connecting them to show clear market direction.
Visual Trend Recognition
A channel sloping upward indicates a bullish condition, while a downward-sloping channel signals a bearish market. This visual representation helps traders instantly recognize the dominating trend.
Highs and Lows as Key Reversal Zones
Each trend line channel includes upper and lower boundaries. These boundaries act as potential Support And Resistance zones where price may reverse, continue, or consolidate. Traders can use these zones to forecast breakout or pullback opportunities.
Benefits of Using the Auto Trend Lines Channels Indicator
Enhances Trend Analysis
The indicator simplifies trend interpretation by clearly displaying slope, structure, and directional bias. Traders can rely on the drawn channels to understand whether the market is trending up, down, or ranging.
Identifies Key Support and Resistance Levels
Trend line channels naturally act as dynamic levels of support and resistance. The upper boundary often suggests selling pressure, while the lower boundary serves as a potential buying zone. These levels help traders develop more informed reversal or breakout strategies.
Improves Accuracy for Traders
Manual trend line drawing can be subjective and error-prone, especially for beginners. The Auto Trend Lines Channels Indicator eliminates this inconsistency by automatically generating accurate and consistent lines, resulting in clearer and more reliable analysis.
Saves Time and Boosts Efficiency
Instead of spending minutes or hours manually drawing trend lines, traders can rely on this indicator to perform the task instantly. This time-saving advantage makes chart analysis faster and more productive, allowing traders to focus more on execution and strategy.
Practical Applications in Trading
Trend Continuation Trades
Traders can follow the channel direction and enter trades when price bounces off the lower boundary (in an uptrend) or upper boundary (in a downtrend).
Trend Reversal Opportunities
As price approaches the extremes of the channel, traders can look for reversal candlestick patterns, divergence signals, or volume confirmation to identify possible turning points.
Breakout Trading
When price breaks above or below a channel boundary, it may indicate the start of a new trend. The indicator helps highlight these breakout areas visually.
Final Thoughts
The Auto Trend Lines Channels Indicator for MT4 is an essential tool for traders who rely on clean market structure and trend clarity. Its ability to automate trend line drawing, reveal dynamic support and resistance levels, and save valuable charting time makes it an excellent addition to any trading toolkit.
To download more premium and free indicators, visit IndicatorForest.com and enhance your technical analysis today.
FAQ
12 Downloads
Published:
Dec 11, 2025 21:56 PM
Category: