Unlock Precise Trend Reversals with the Color Fisher Indicator
In technical analysis, identifying the exact moment a trend loses steam and prepares to reverse is the "Holy Grail" for many traders. While standard oscillators like the RSI or Stochastic are popular, they often suffer from lag or provide ambiguous signals in trending markets. The Color Fisher Indicator is a powerful alternative that applies the Fisher Transform mathematical formula to Price Action, creating a highly responsive tool for spotting trend changes with remarkable clarity.
The Science Behind the Fisher Transform
The Color Fisher is based on the work of J.F. Ehlers, who proposed that price action does not follow a normal probability distribution (the "bell curve"). Instead, market prices tend to stay at extremes for long periods. The Fisher Transform converts price into a Gaussian normal distribution. In simpler terms, it takes "noisy" price data and transforms it into sharp, clear peaks and valleys.
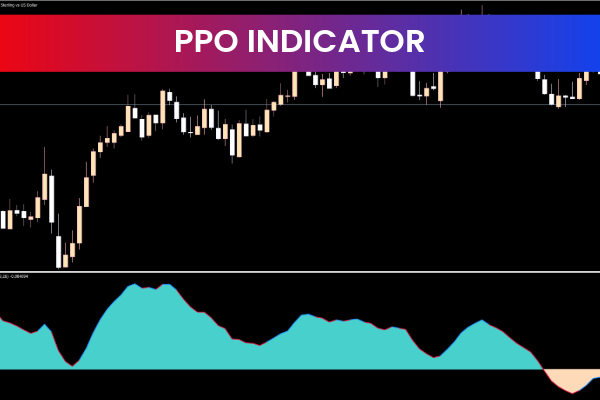
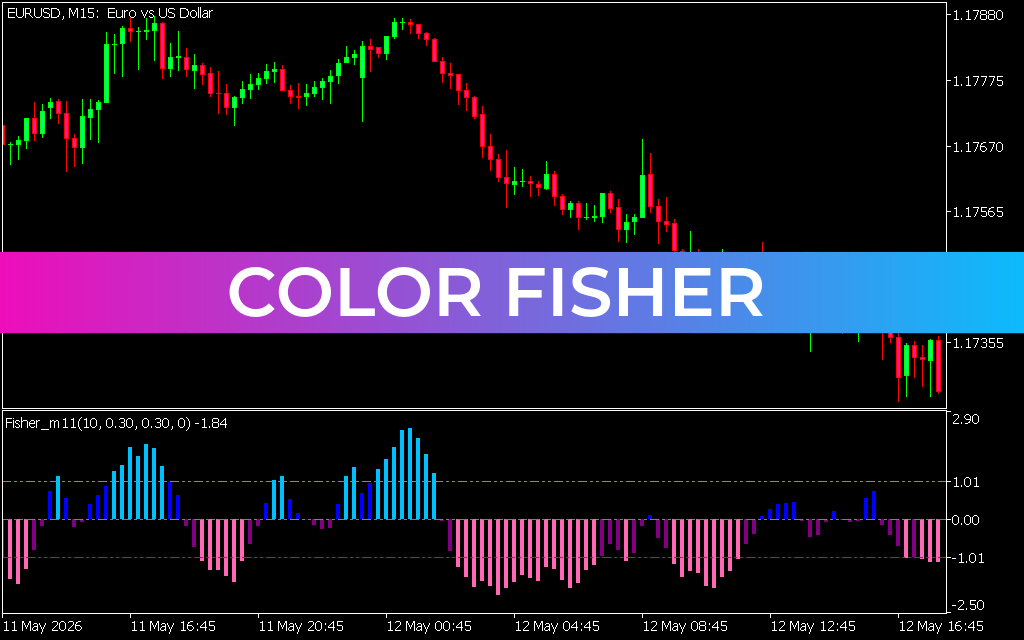
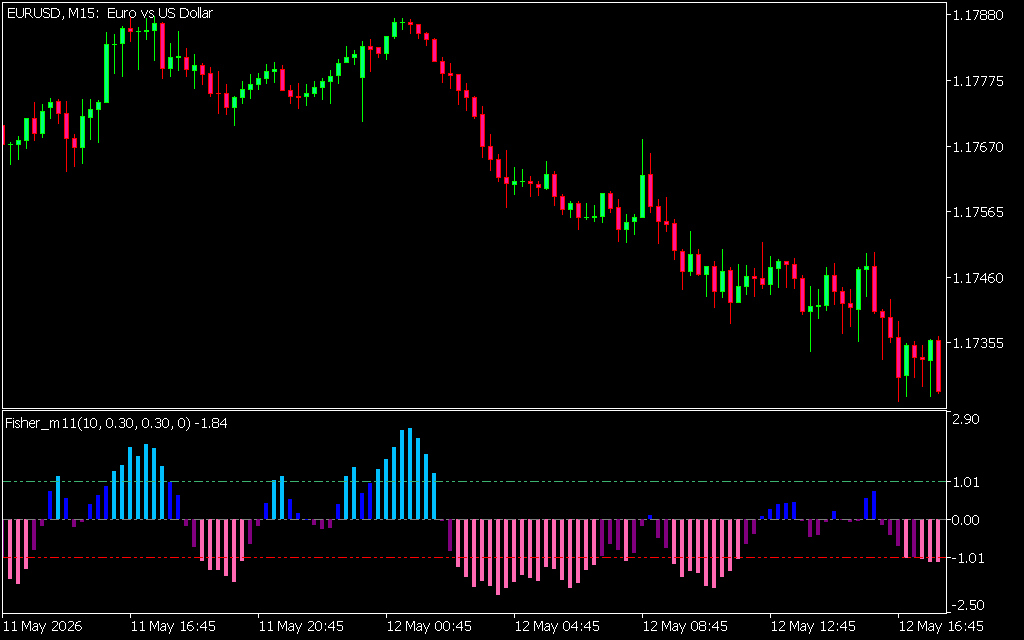
As shown in the EURUSD M15 chart, this transformation results in a histogram that oscillates around a zero line. Unlike traditional oscillators that look "rounded," the Color Fisher creates sharp turns, making it much easier for a trader to see exactly when momentum has peaked.
Visual Clarity: Color-Coded Histograms
The "Color" aspect of this indicator is what makes it a favorite among day traders and scalpers. It simplifies complex mathematics into a visual shorthand:
- Sky Blue / Blue Bars: These indicate strong bullish momentum. When the bars are rising above the zero line and maintain a bright blue hue, the buyers are in control.
- Pink / Purple Bars: These signify bearish momentum. When the histogram dips below the zero line and turns pink, it suggests that selling pressure is accelerating.
By using these color changes, traders can avoid the "analysis paralysis" that often comes with staring at raw price action. A shift from blue to pink provides an immediate signal that the current trend may be exhausted.
Strategic Implementation
The Color Fisher is exceptionally versatile and can be used across various timeframes and asset classes.
- Zero-Line Crossovers: A classic strategy involves watching for the histogram to cross the zero midpoint. A move from negative to positive is a buy signal, while a move from positive to negative is a sell signal.
- Peak Divergence: Just like the MACD, traders can look for "divergence." If price makes a new high but the Color Fisher makes a lower high, a significant bearish reversal is likely on the horizon.
- Confluence with Price Action: In the provided image, the Color Fisher accurately tracks the downward slide of the EURUSD. Traders who waited for the pink bars to develop below the zero line could have captured the meat of that bearish move with confidence.
Conclusion
The Color Fisher Indicator is a must-have for traders who want to strip away market noise and focus on pure momentum. By normalizing price data through the Fisher Transform, it provides a unique perspective that standard indicators simply cannot match. Whether you are Scalping the M15 or swing trading the daily charts, the Color Fisher offers the visual clarity and mathematical precision needed to stay ahead of the curve.
3 Downloads
Last Update:
May 13, 2026 13:54 PM
Published:
Jan 23, 2026 10:58 AM
Category: