Master Market Momentum: A Deep Dive into the Total Power Indicator for MT5
In the fast-paced world of Forex and CFD trading, the ability to distinguish between a ranging market and a strong trend is the difference between a winning streak and a depleted account. For MetaTrader 5 (MT5) users, the Total Power Indicator has emerged as a sophisticated tool designed to solve this exact problem. By combining the strengths of multiple momentum oscillators, this indicator provides a multi-layered view of market sentiment that single-tool setups often miss.
What is the Total Power Indicator?
The Total Power Indicator is a comprehensive technical analysis tool that measures the "bullish" and "bearish" strength within a specific timeframe. Unlike standard RSI or Stochastic indicators that simply show overbought or oversold conditions, the Total Power Indicator calculates the dominance of buyers versus sellers.
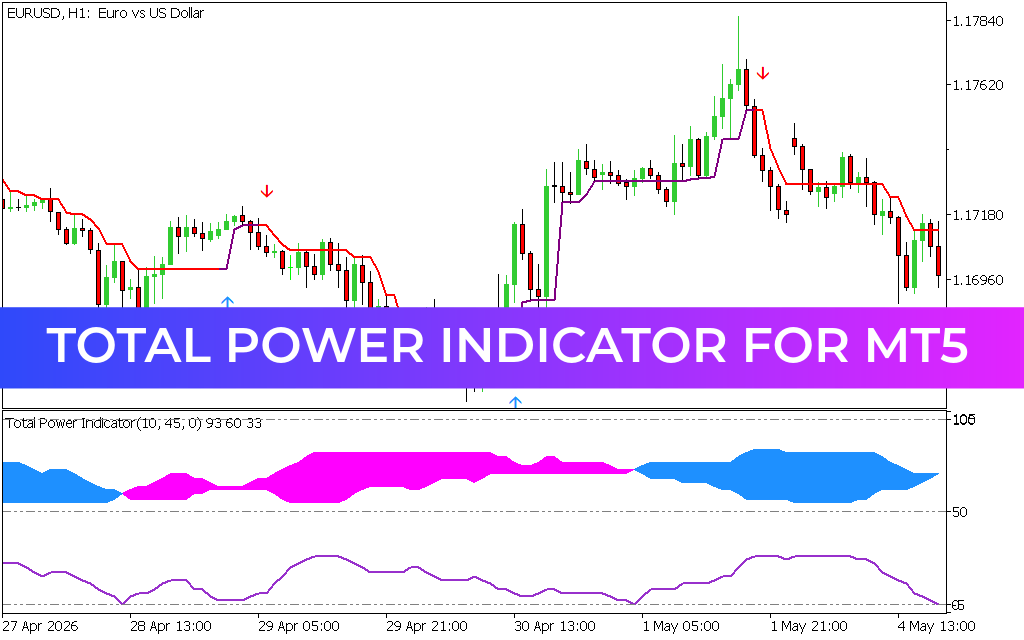
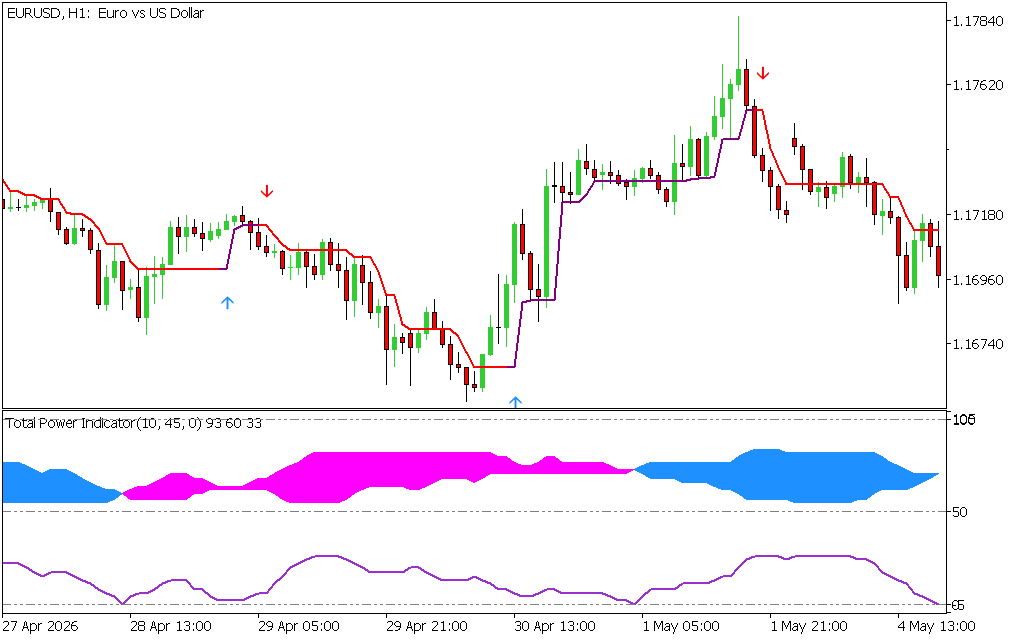
As seen in the EURUSD H1 chart, the indicator typically consists of two primary components:
- The Histogram/Cloud: Represented by the blue and magenta filled areas, this visualizes the current power balance. Blue typically signifies bullish dominance, while magenta indicates bearish pressure.
- The Signal Line: An oscillating line at the bottom that tracks the intensity of the trend, helping traders spot potential exhaustion points or trend continuations.
Why Trade with Total Power on MT5?
The MT5 platform’s advanced architecture allows the Total Power Indicator to process data with high precision. Here is why it belongs in your trading toolkit:
- Trend Confirmation: It acts as a filter. If your Price Action strategy suggests a "buy," but the Total Power Indicator shows a magenta cloud, it warns you of underlying bearish strength.
- Reduced Market Noise: By aggregating data, it smooths out the "choppiness" of minor price fluctuations, allowing you to stay in profitable trends longer.
- Visual Clarity: The color-coded cloud system provides instant feedback. Traders can immediately identify the path of least resistance without over-analyzing raw candle data.
Trading Strategies with Total Power
To maximize the effectiveness of the Total Power Indicator, consider a Confluence Strategy. In the provided chart, notice how the indicator shifts from magenta to blue just as the price breaks above the stepped moving average line. This alignment—where the indicator cloud matches the price direction—offers a high-probability entry signal.
Conversely, when the blue cloud begins to shrink or the signal line crosses back toward the 50-level, it suggests that the trend is losing steam. This is often an ideal time to tighten stop-losses or take partial profits.
The Bottom Line
The Total Power Indicator for MT5 is not just another oscillator; it is a sentiment gauge. By understanding the "power" behind the price, you move away from guessing and toward data-driven execution. Whether you are a scalper looking for quick momentum bursts or a swing trader following long-term cycles, this indicator provides the clarity needed to navigate the markets with confidence.
3 Downloads
Last Update:
May 08, 2026 00:56 AM
Published:
Jan 26, 2026 18:23 PM
Category: