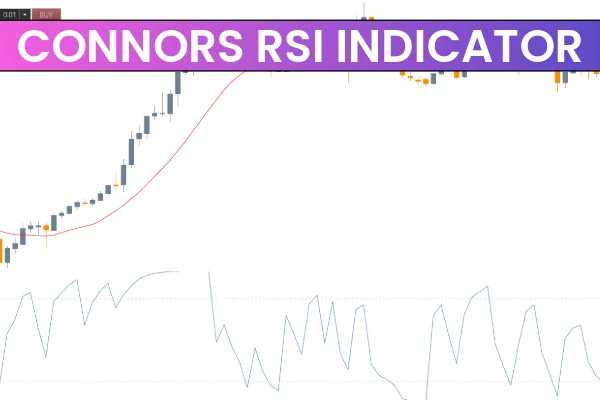
The Connors RSI Indicator for MT4 is an advanced version of the classic Relative Strength Index developed by professional trader Larry Connors. Unlike the standard RSI that uses a 14-period setting, the Connors RSI uses a 2-period sensitivity which allows it to react much faster to price fluctuations. This makes it especially valuable for scalpers, short-term traders, and day traders who rely on quick signals and rapid momentum shifts.
The Connors RSI combines multiple components of momentum analysis, offering a clearer view of market strength. Its oversold level is set below 10, while the overbought level is placed at 90, giving traders more extreme trigger zones and reducing noise from false signals.
Whether you're trading forex, indices, metals, or crypto on MT4, the Connors RSI is a powerful timing tool for spotting precise reversal opportunities.
How the Connors RSI Indicator Works
Unlike a standard RSI, the Connors RSI considers:
Short-term momentum (2-period RSI)
Price streak duration
Rate-of-change ranking
This combination gives sharper signals and helps traders see when the market has truly exhausted buying or selling pressure.
The indicator can be applied to:
Any MT4 timeframe (M1 to MN1)
Any currency pair or asset
Multiple trading strategies
Customization options allow users to adjust periods, levels, and visual styles based on preference.
How to Trade Using the Connors RSI Indicator
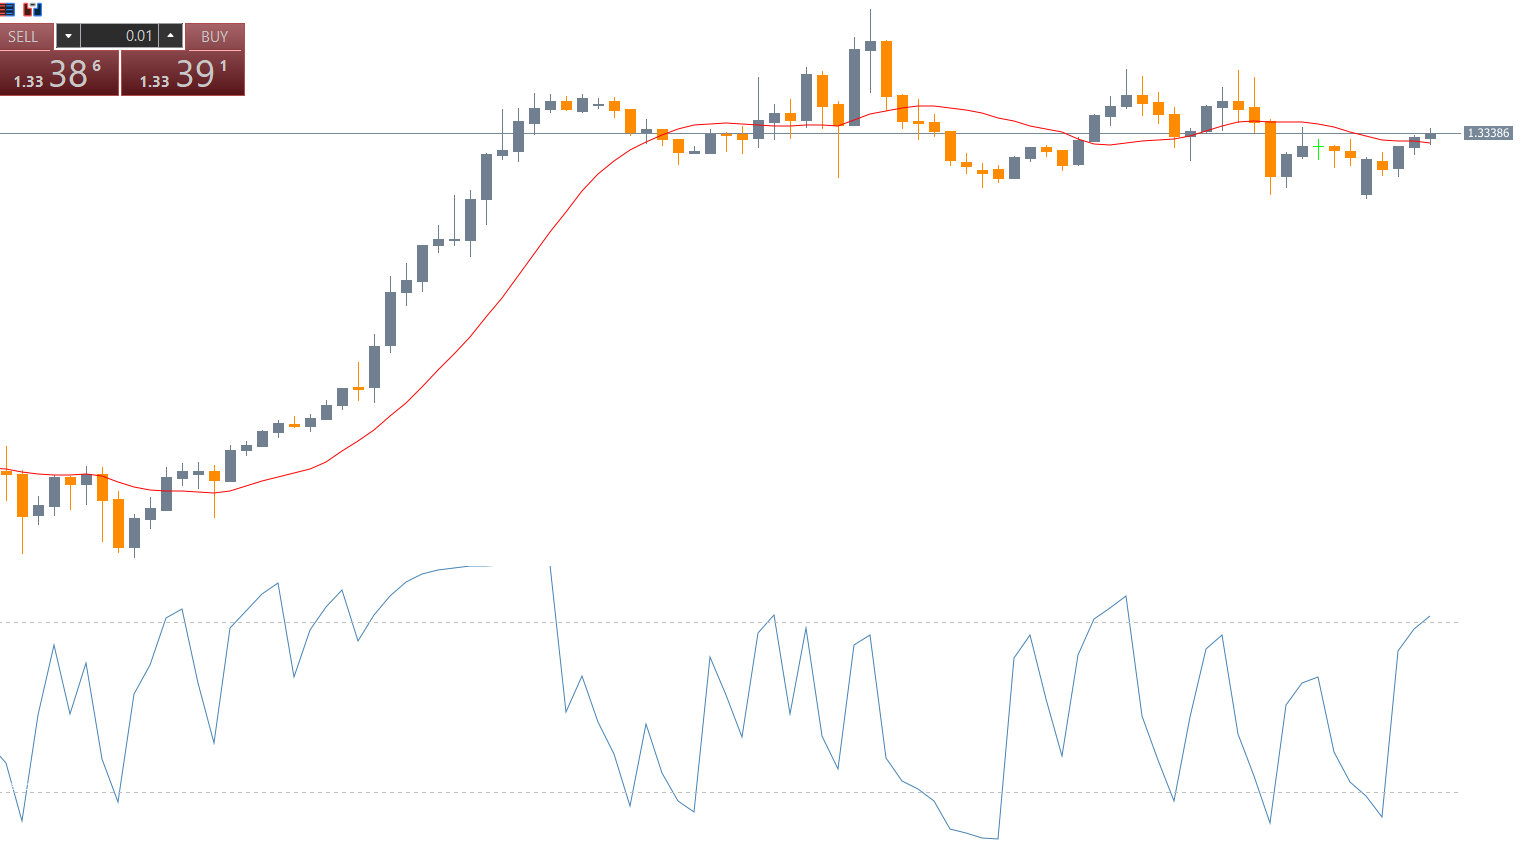
The Connors RSI works similarly to the standard RSI concept but uses more responsive levels.
Buy Signal Strategy
A buy setup occurs when:
The indicator value falls below 10 (extreme oversold zone)
Price begins to reverse upward
Market Structure confirms support
In this case, traders may enter a long trade expecting a bullish recovery or upward continuation.
Stop-loss may be placed below the most recent support or candlestick swing low.
Sell Signal Strategy
A sell setup appears when:
The indicator rises above 90
Price slows down or forms reversal candlesticks
Momentum begins to fade
This condition suggests exhaustion, meaning sellers may soon dominate the market.
Stop-loss can be set above the recent swing high.
Example Trade Scenario
On a GBP/EUR H4 chart, the Connors RSI shows a strong reading above 90. Shortly after, the price reverses sharply and begins trending downward. This indicates that buyers have exited, causing a market drop.
Later, the indicator enters the oversold zone near the 10-level. Sellers begin to exit, and the price rebounds upward, signaling a valid long reversal trade.
Advantages of the Connors RSI Indicator
Using the Connors RSI Indicator provides several benefits:
Faster response time
More reliable levels
Better reversal accuracy
Works well in ranging markets
Ideal for intraday trading and Scalping
For best performance, traders often combine Connors RSI with Price Action tools such as support/resistance zones, moving averages, MACD, or trendlines.
Final Thoughts
The Connors RSI Indicator for MT4 offers a more advanced and precise version of traditional RSI analysis. With its fast responsiveness, strong reversal accuracy, and customizable settings, it is an excellent tool for identifying overbought and oversold market conditions.
👉 Download the Connors RSI Indicator now at IndicatorForest.com and enhance your trading strategy with precision-based signals.
FAQ
4 Downloads
Published:
Dec 07, 2025 21:57 PM
Category: