Decode Market Efficiency: Ultimate Guide to the XPFE Indicator
In technical analysis, traders constantly search for a definitive way to separate highly profitable trending phases from choppy, capital-destroying consolidations. When an asset enters a powerful trend, momentum strategies thrive. However, when the market loses efficiency and enters a tight sideways range, those same strategies frequently trigger a painful series of false breakouts.
To solve this core trading dilemma, advanced market technicians look beyond standard oscillators. They turn to fractal mathematics and efficiency models to determine the true structural state of Price Action. The XPFE Indicator (Exponential Polar Fractal Efficiency) is engineered precisely for this task, giving you a mathematically objective look at market efficiency and trend sustainability.
What is the XPFE Indicator?
The XPFE Indicator is a sophisticated momentum and trend-filtering oscillator designed for modern trading platforms. It builds upon classic Fractal Efficiency concepts, which compare the straight-line distance between two price points against the actual path price took to get there. If price traveled directly from point A to point B, the market is highly efficient (strongly trending). If it fluctuated wildly in a massive zigzag to cover the same distance, the market is inefficient (ranging).
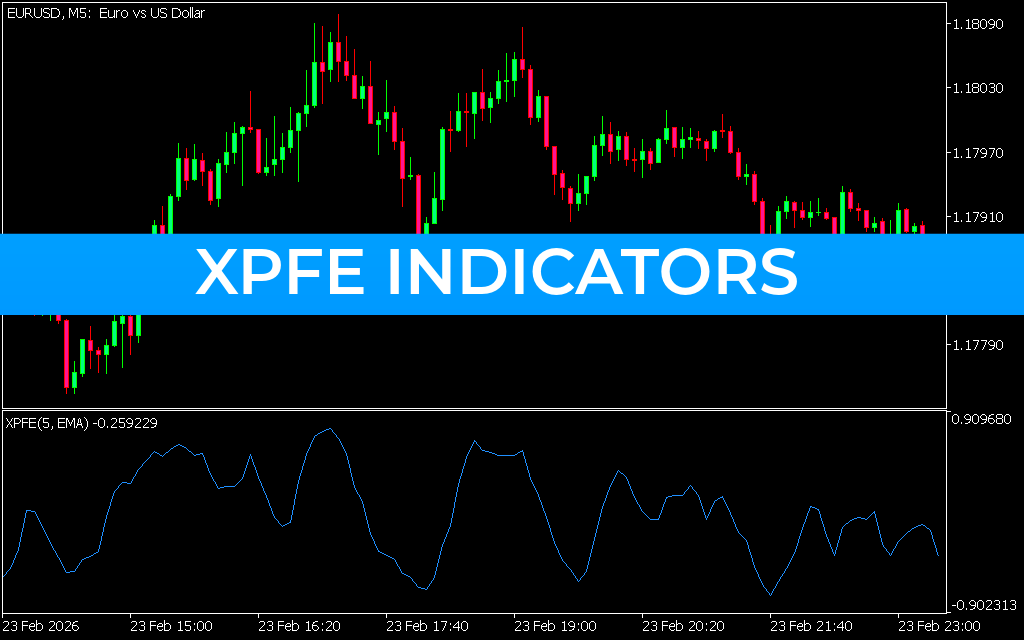
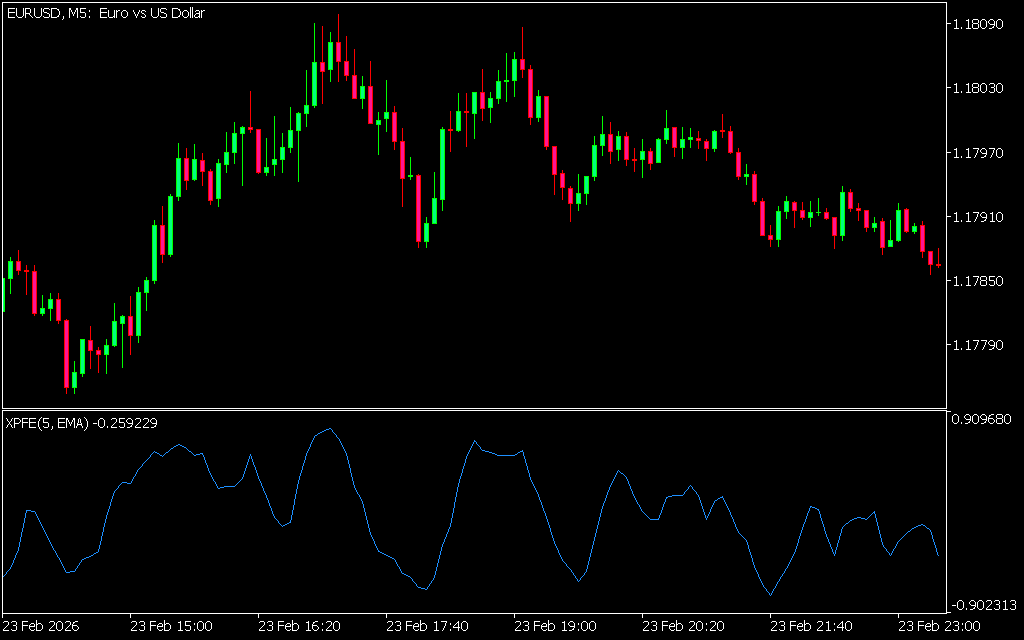
As displayed in the EUR/USD 5-minute (M5) chart above, the indicator outputs a smooth, highly responsive single-line wave (XPFE(5, EMA)) in a dedicated sub-window beneath the candlesticks. By smoothing the raw fractal calculations with an internal Exponential Moving Average (EMA) matrix, it eliminates erratic data spikes and provides an incredibly clean visualization of shifting institutional momentum.
Key Features and Strategic Advantages
- Fractal-Based Trend Filtering: Quantifies the structural efficiency of price movement, helping you easily identify whether a trend has true institutional backing.
- Smoothed Moving Average Logic: The built-in EMA smoothing filter removes minor intraday price noise, preventing the line from fluctuating erratically during low-volume sessions.
- Early Range Warnings: Visually warns you when an active trend is losing mathematical efficiency, allowing you to tighten your stop-losses or lock in profits before a consolidation phase begins.
- Multi-Timeframe Scalability: Performs with exceptional accuracy across all charting horizons, giving high-frequency M5 scalpers and daily swing traders identical structural clarity.
How to Trade with the XPFE Indicator
Integrating the XPFE efficiency model into your daily operations simplifies your trade execution logic into two major techniques:
- The Core Momentum Crossover: Tracking how the line moves around its central zero equilibrium axis helps establish a definitive market bias. When the line breaks sharply above zero, it signals that buyers are moving the market efficiently upward. When it drops firmly below zero, sellers have taken efficient control of the markdown phase.
- Trend Exhaustion Detection: When the oscillator stretches to its extreme upper or lower numerical boundaries, the current price expansion is running at maximum efficiency. If the line begins to curve back toward the center axis from these extremes, it highlights a sharp drop in market efficiency—warning you that the current trend is exhausting and a reversal or range bound phase is imminent.
Last Update:
May 24, 2026 02:56 AM
Published:
Jan 15, 2026 16:15 PM
Category: