Unlocking Market Precision: The Ultimate Guide to the Absolute Strength Indicator
To survive and thrive in modern financial markets, a trader needs to know two things with absolute certainty: who is currently driving the market, and how much power do they have left? Traditional momentum tools like the standard Relative Strength Index (RSI) or Stochastic Oscillator can tell you if a market is overbought or oversold, but they often fail to pinpoint the exact handoff of power between bulls and bears. Enter the Absolute Strength indicator, a sophisticated, institutional-grade technical utility engineered to dissect market forces and give you an unshakeable edge.
Unlike standard single-line oscillators, the Absolute Strength indicator acts as a real-time tug-of-war map. By calculating the independent, localized energy of both buyers and sellers simultaneously, it exposes the underlying mechanics of Price Action before it fully reflects on your main chart.
Decoding the Power Dynamics of Absolute Strength
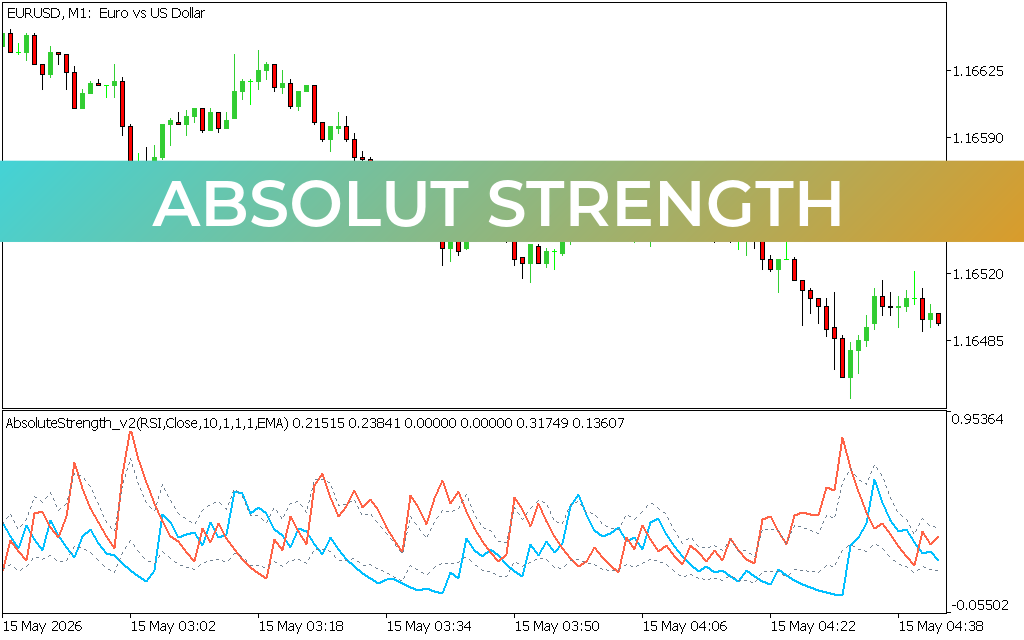
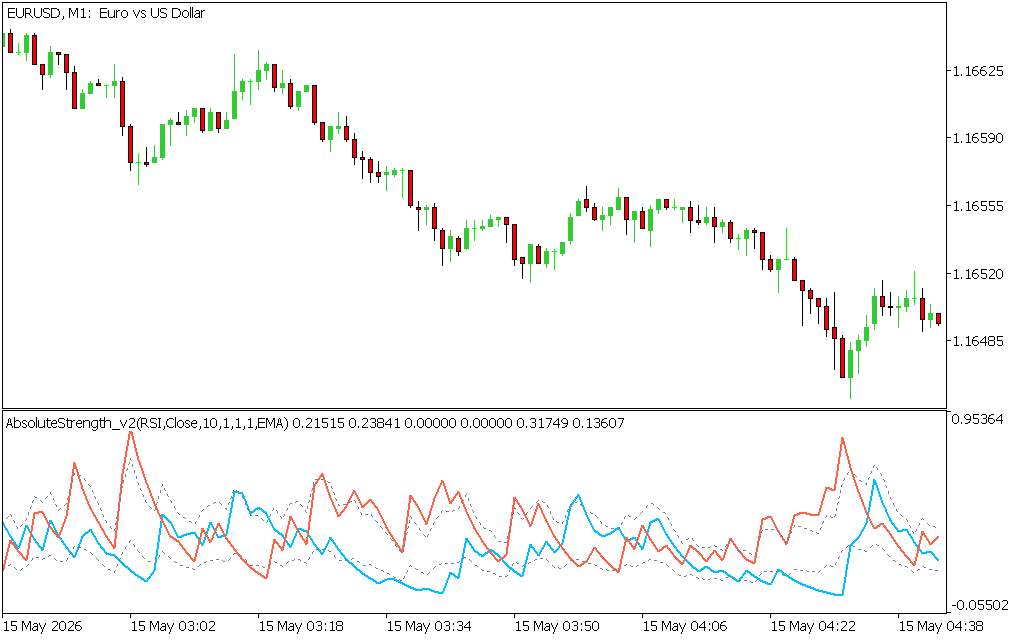
The magic of the Absolute Strength indicator lies within its specialized sub-window, which maps market velocity through an elegant dual-line system. When loading this tool onto a highly liquid pair like the EUR/USD, you gain instant clarity via two distinct components:
- The Bullish Momentum Line (Blue): This line tracks the absolute buying pressure in the market. When the blue line is rising and dominating the upper half of the window, it proves that bulls are actively stepping on the gas, confirming that long positions and trend-following setups have a high probability of success.
- The Bearish Momentum Line (Orange/Red): This line measures the pure, raw energy of the sellers. As displayed beautifully during rapid downward micro-trends, a sudden, aggressive spike in the orange line highlights a massive influx of institutional short-selling volume, signaling an immediate need to align with the bears.
- The Dynamic Channel (Dotted Mid-Lines): Operating between the dominant momentum lines is a statistical baseline. When both the blue and orange lines collapse inward or flatten within this channel, it signals a low-volume squeeze or a trendless, choppy market condition—the ultimate visual cue to stand aside.
Designed for High-Velocity Execution
Because the Absolute Strength indicator utilizes a highly advanced smoothing algorithm (often combining RSI metrics with Exponential Moving Averages), it is uniquely insulated against the random market noise that plagues lower-timeframe analysis. This makes it an invaluable asset for technical trading styles like 5-minute Scalping or sixty-second micro-trades on the 1-minute (M1) chart.
Instead of chasing a sudden price drop and getting trapped by a fakeout, you simply look at your indicator window. A valid, high-velocity breakout is confirmed only when the orange line aggressively crosses above the blue line while simultaneously breaking out of the dotted midline channel. By synchronizing price action with raw volume velocity, the Absolute Strength indicator transforms your MetaTrader platform into a definitive market-mapping machine.
1 Download
Last Update:
May 17, 2026 16:01 PM
Published:
Jan 20, 2026 21:42 PM
Category: