Mastering Market Explosions with the Volatility Ratio Indicator for MT5
In the high-stakes arena of Forex and CFD trading, the ability to distinguish between a stagnant market and an impending breakout is what separates professional traders from the rest. While many indicators focus solely on price direction, the Volatility Ratio Indicator for MetaTrader 5 (MT5) addresses the engine of market movement: volatility. By quantifying the expansion and contraction of Price Action, this tool helps traders anticipate explosive moves before they occur, making it an essential component for any breakout or trend-following strategy.
Understanding the Mechanics of Volatility Ratio
The Volatility Ratio is a technical oscillator designed to measure the relative volatility of an asset over a specific period compared to its historical average. It operates on the principle of "volatility clustering"—the phenomenon where periods of low volatility (consolidation) are almost always followed by periods of high volatility (expansion).
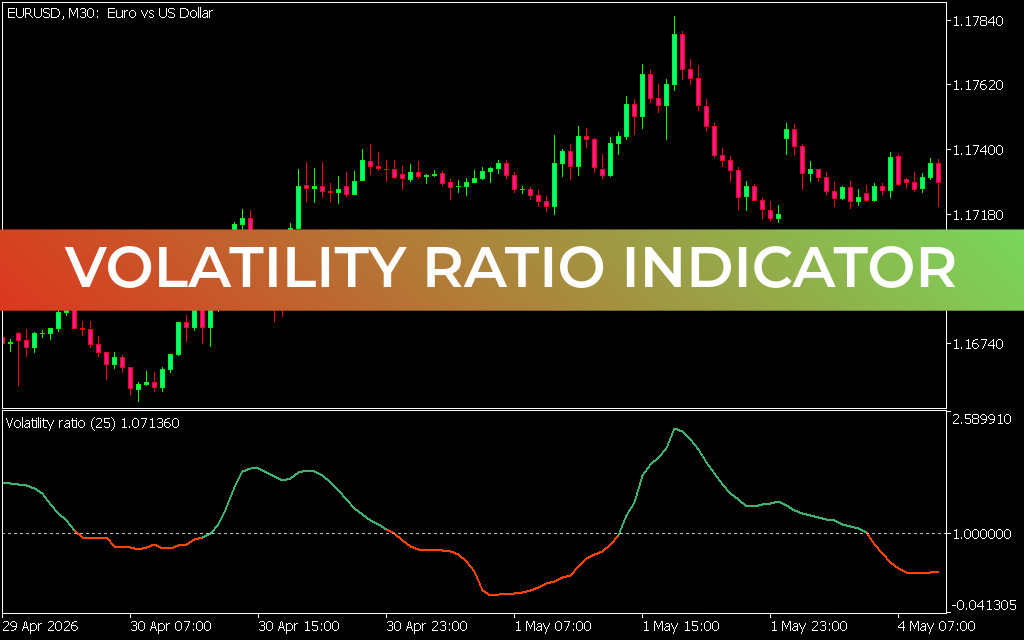
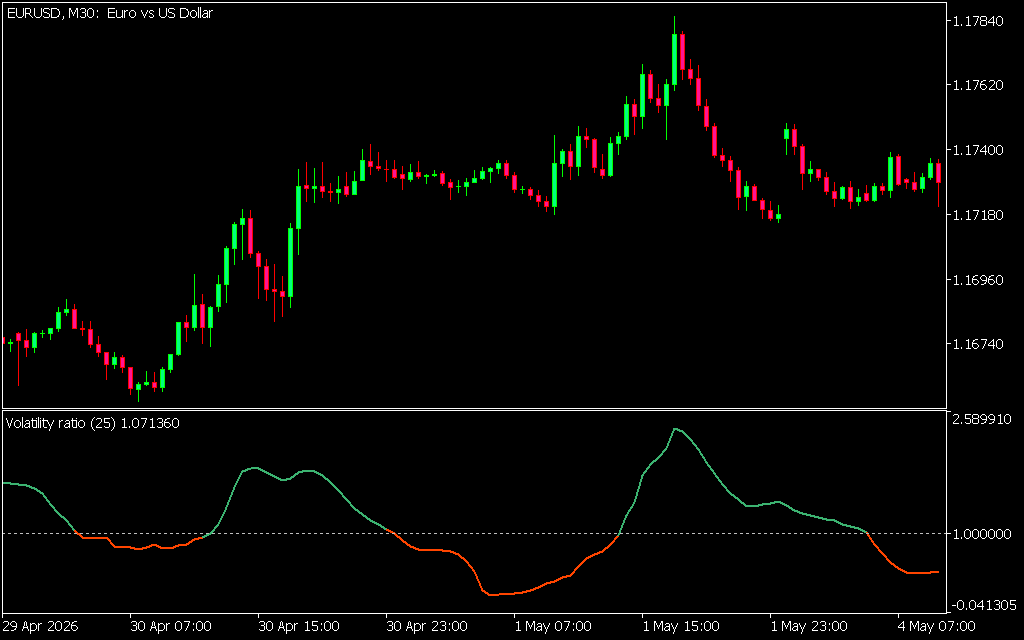
As illustrated in the EUR/USD M30 chart, the indicator appears in a separate window below the price action. It features a dynamic signal line that oscillates around a central threshold of 1.000000.
- The Green Zone: When the line is green and rising above 1.00, it indicates that current market volatility is expanding beyond the average. This is the "expansion phase" where trends are most likely to sustain their momentum.
- The Orange/Red Zone: When the line is orange and falls below 1.00, the market is in a "contraction phase." During these times, price often moves sideways in a tight range as the market builds energy for the next significant move.
Strategic Visuals and Trading Signals
The Volatility Ratio for MT5 provides a clean, color-coded interface that simplifies complex market data:
- Breakout Confirmation: One of the most powerful ways to use this indicator is as a filter for breakouts. If price breaks a key resistance level while the Volatility Ratio is surging into the green zone (as seen in the late April move on the EUR/USD chart), the probability of a genuine breakout is significantly higher.
- Trend Exhaustion: A peak in the green zone followed by a sharp decline suggests that the "burst" of energy is fading. For trend followers, this is a vital signal to take profits or move stop-losses tighter, as the market is likely entering a new consolidation phase.
- Range Identification: When the indicator remains consistently in the orange zone below 1.00, it identifies a low-volatility environment. Professional traders often avoid large positions during these times, waiting for the indicator to "flip" green to signal a fresh entry.
Why Integrate This Tool into Your MT5 Setup?
The primary advantage of the Volatility Ratio is its ability to reduce "market noise." Standard oscillators like the RSI or Stochastic can often give false signals in a flat market. By adding a volatility filter, you ensure that you are only entering the market when there is enough "fuel" (volatility) to move price toward your target.
Whether you are a scalper looking for quick intraday bursts or a swing trader identifying major trend shifts, the Volatility Ratio for MT5 provides the quantitative clarity needed to trade with professional-grade precision. By monitoring the ratio of current to historical movement, you can stay one step ahead of market cycles.
7 Downloads
Last Update:
May 11, 2026 21:47 PM
Published:
Jan 24, 2026 13:14 PM
Category: