The AMA Smoothed RSI Indicator for MT5 is a powerful forex trading tool that functions like the traditional Relative Strength Index (RSI) but with added precision and smoothness. It identifies overbought and oversold conditions, highlights bullish and bearish divergences, and delivers more reliable trend reversal signals. This indicator is ideal for traders who want clearer momentum insights and fewer false signals.
How the AMA Smoothed RSI Indicator Works
The AMA Smoothed RSI Indicator applies an Adaptive Moving Average (AMA) to the traditional RSI formula, making the resulting signal line smoother and more responsive to true market trends.
The indicator displays a single line, similar to RSI, that moves between the standard 0–100 scale. However, the smoothing effect helps filter out noise and provides more accurate insights into price strength.
When the indicator rises above 70, it signals an overbought condition and potential for a sell trade.
When it drops below 30, it indicates an oversold condition and possible buy opportunity.
Divergences between the indicator and price can predict trend reversals early.
AMA Smoothed RSI Indicator for MT5 Trading Signals
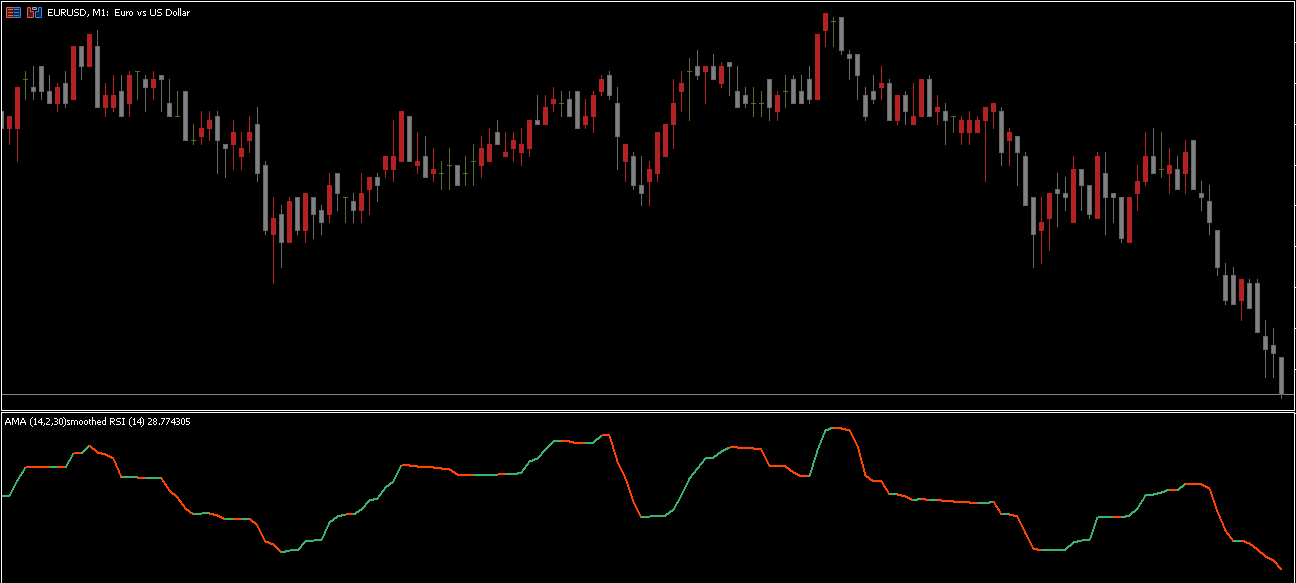
The chart example of the USDCHF H1 timeframe demonstrates how the indicator produces actionable buy and sell signals.
Buy Signal: When the indicator dips below 30 (oversold area) and begins to rise, it shows the downtrend is weakening, signaling a potential bullish reversal.
Sell Signal: When the indicator crosses above 70 (overbought zone) and starts to fall, it suggests the uptrend is losing momentum, indicating a bearish reversal.
The indicator can also identify divergence signals. For example, if the price forms a lower low while the indicator forms a higher low, it signals bullish divergence, often preceding an upward price move.
Why Use the AMA Smoothed RSI Indicator
The AMA Smoothed RSI Indicator for MT5 provides several advantages over the classic RSI:
Enhanced Signal Accuracy: The adaptive smoothing reduces noise and false signals.
Improved Trend Detection: Clearly shows the beginning and end of market trends.
Divergence Identification: Helps spot hidden momentum shifts early.
Flexible Timeframe Use: Works effectively on all timeframes — from Scalping (M1) to long-term trading (D1 or W1).
Although it can be used on lower timeframes, longer ones (like H1 and above) tend to yield more reliable results by reducing whipsaws.
Free Download and Installation
The AMA Smoothed RSI Indicator for MT5 is completely free to download. After downloading, place the indicator file in your MQL5 → Indicators folder, restart your MetaTrader 5 platform, and attach it to your desired chart.
You can adjust parameters such as the RSI period or AMA smoothing factor to match your trading strategy.
Conclusion
In summary, the AMA Smoothed RSI Indicator for MT5 refines the classic RSI by incorporating adaptive smoothing for more accurate and timely trading signals. It’s simple to use yet powerful enough for professional analysis. Whether you’re a beginner or an experienced trader, this indicator offers clear BUY/SELL signals, detects trend reversals, and enhances overall trading precision.
Best of all, the AMA Smoothed RSI Indicator is free to download — making it an essential tool for any forex trader’s MT5 toolkit.
FAQ
2 Downloads
Published:
Nov 07, 2025 01:33 AM
Category: