Spot Structural Shifts Early with the TMACD Divergence Indicator
In liquid financial markets, chasing momentum that is already exhausted is one of the primary drivers of retail account drawdown. Many day traders rely on basic moving average indicators that only signal a trend phase after the majority of the price extension has already occurred. By entering late, traders expose their capital to sudden institutional profit-taking events. To build a sustainable technical edge, professional market participants utilize volume and price disparities to anticipate turning points. The TMACD Divergence indicator for MetaTrader is engineered to automate this workflow, pinpointing high-probability reversals before they materialize on your price panels.
The Advanced Mechanics of Triangular Smoothing and Divergences
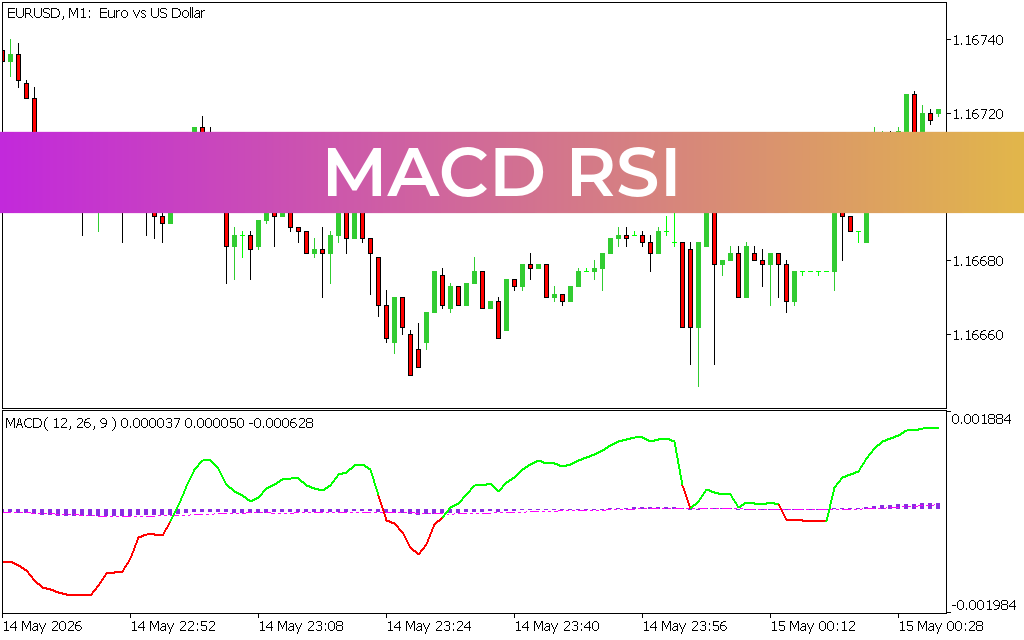
The TMACD Divergence utility is an advanced momentum oscillator that populates within a dedicated sub-window below your primary candlestick chart. Unlike a traditional Moving Average Convergence Divergence (MACD) engine that relies on standard exponential averages, this tool incorporates a Triangular Moving Average (TMA) core algorithm. By double-smoothing price data, the formula filters out erratic intraday chart spikes and market noise, resulting in a cleaner, highly reliable velocity curve.
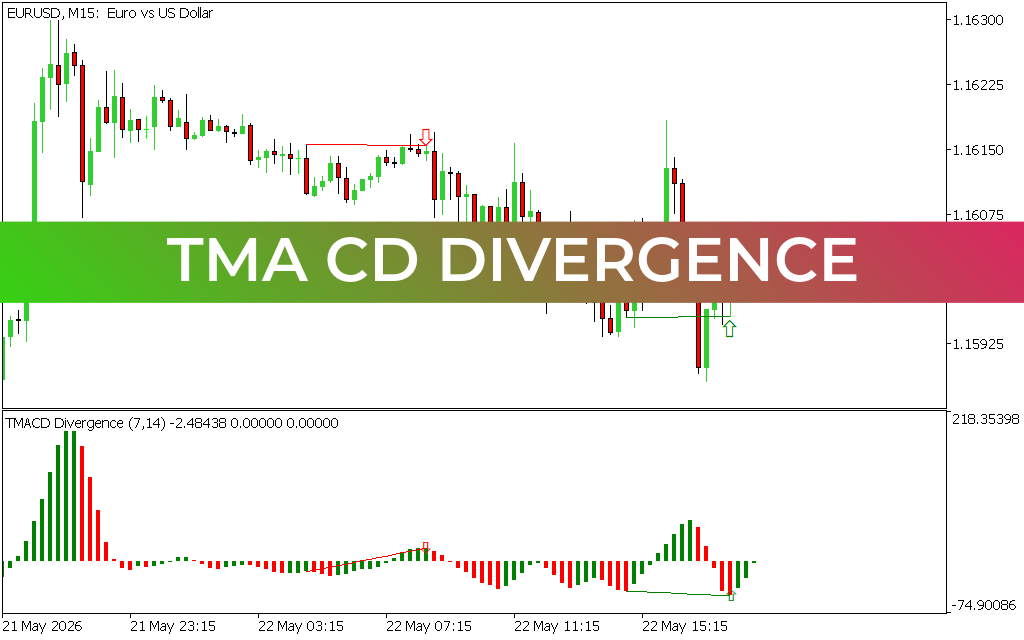
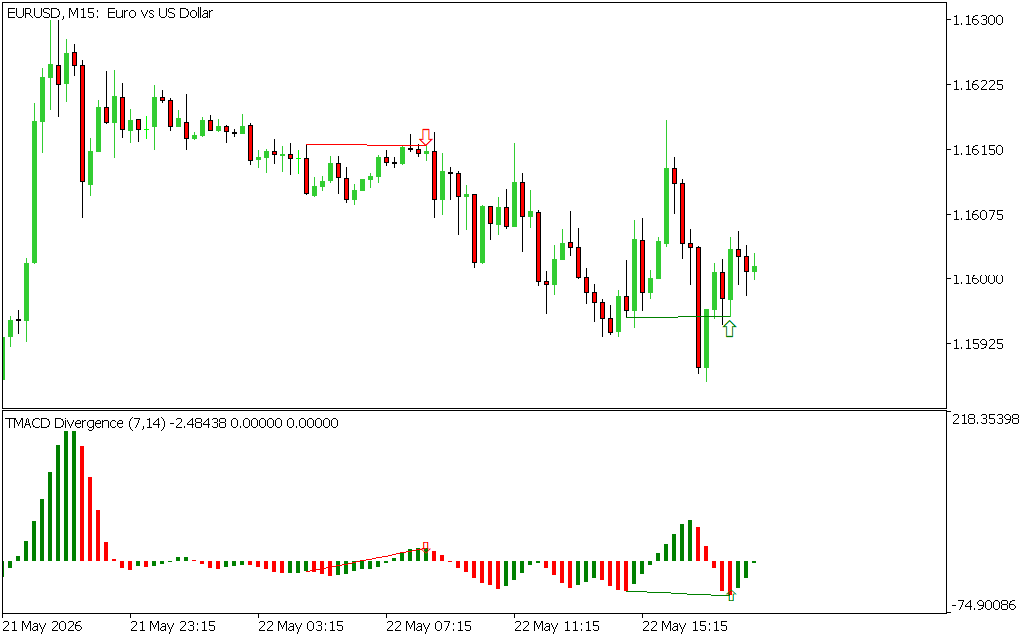
As displayed on the EURUSD 15-minute workspace, the system translates complex data into an actionable visual matrix:
- The Dual-Color Histogram Matrix: Green vertical histogram bars indicate expanding bullish velocity, while red vertical bars reveal dominant bearish distribution.
- Automated Trendlines and Arrows: The custom script actively scans the workspace for structural discrepancies between swing points and histogram peaks. When a valid setup forms, it mechanically draws connection lines on the price panel and oscillator window, printing a green upward arrow for buy signals or a red downward arrow for sell setups.
- The Zero-Line Equilibrium Axis: Serves as the ultimate momentum divider. Crosses above or below the 0.00 threshold help scalpers determine whether buyers or sellers control the broader market session.
Key Trading Features and Strategic Advantages
- Automated Divergence Scanning: Removes the subjectivity of manual charting by mechanically calculating both regular and hidden divergences in real time.
- Double-Smoothed Signal Quality: The underlying TMA code minimizes false crossovers and whipsaws commonly found in highly volatile trading sessions.
- Clean Chart Architecture: Confining the main historical histograms to a lower pane ensures your primary workspace remains completely open for tracking key support lines or order blocks.
- Multi-Timeframe Versatility: While highly optimized for identifying session reversals on the 15-minute layout, the mathematical settings scale fluidly across M5, H1, or H4 charts.
Execution Strategies for Disciplined Risk Management
To transform the TMACD Divergence indicator into a profitable mechanical strategy, apply a structured execution framework:
- The Classic Reversal Setup: Monitor the market as price approaches a key psychological zone. If price prints a higher high but the TMACD histogram prints a clear lower high, wait for the red automated arrow to confirm institutional distribution before executing a short position.
- The Zero-Line Crossover Filter: Increase your win rate by using the 0.00 axis as a structural filter. Only accept bullish divergence setups if the histogram bars are actively migrating from deep negative territory back toward the zero baseline.
- Calibrated Capital Protection: Place your protective stop-loss a few pips beyond the physical swing high or low highlighted by the automated indicator arrow. This keeps your downside risk strictly capped while chasing maximum rotational profits.
7 Downloads
Last Update:
May 22, 2026 20:50 PM
Published:
Jan 17, 2026 14:37 PM
Category: