The Power of Two: The MACD RSI Indicator for MetaTrader 5
In technical analysis, relying on a single indicator can often lead to false signals and costly market entries. Trend-following indicators excel in strong trends but fail during consolidations, while momentum oscillators perform beautifully in ranges but give premature reversal signals during strong breakouts. To solve this structural issue, professional traders use the MACD RSI Indicator for MetaTrader 5 (MT5)—a hybrid technical tool that combines two of the world's most powerful indicators into a single, cohesive trading system.
Understanding the MACD RSI Synergy
The MACD RSI indicator elegantly fuses the trend-following capabilities of the Moving Average Convergence Divergence (MACD) with the overbought and oversold precision of the Relative Strength Index (RSI). Instead of cluttering your MT5 screen with multiple sub-windows, this indicator overlays their mathematical principles to provide an optimized, noise-filtered perspective on Price Action.
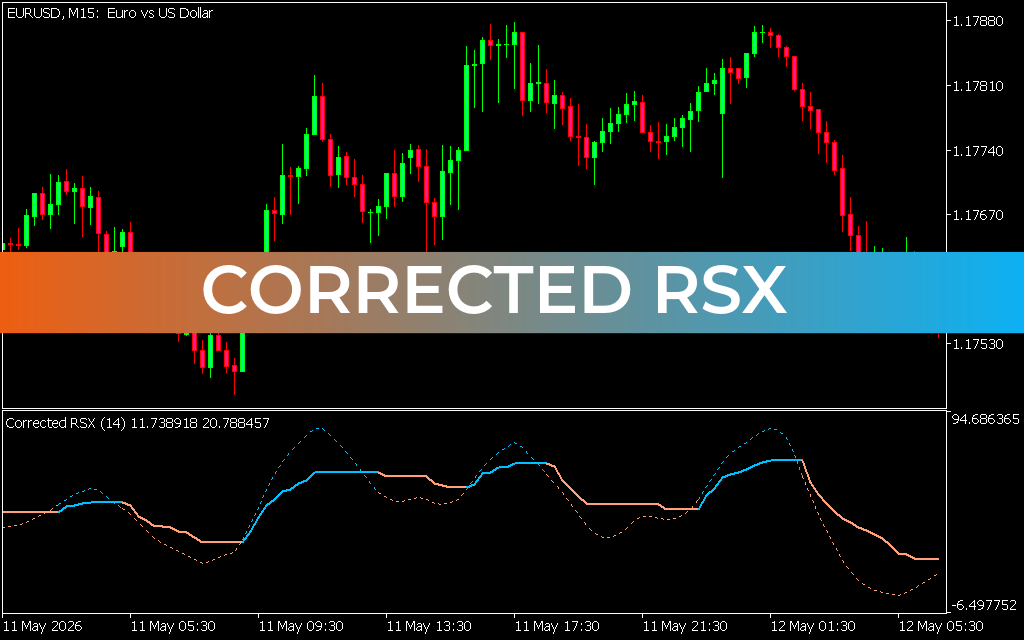
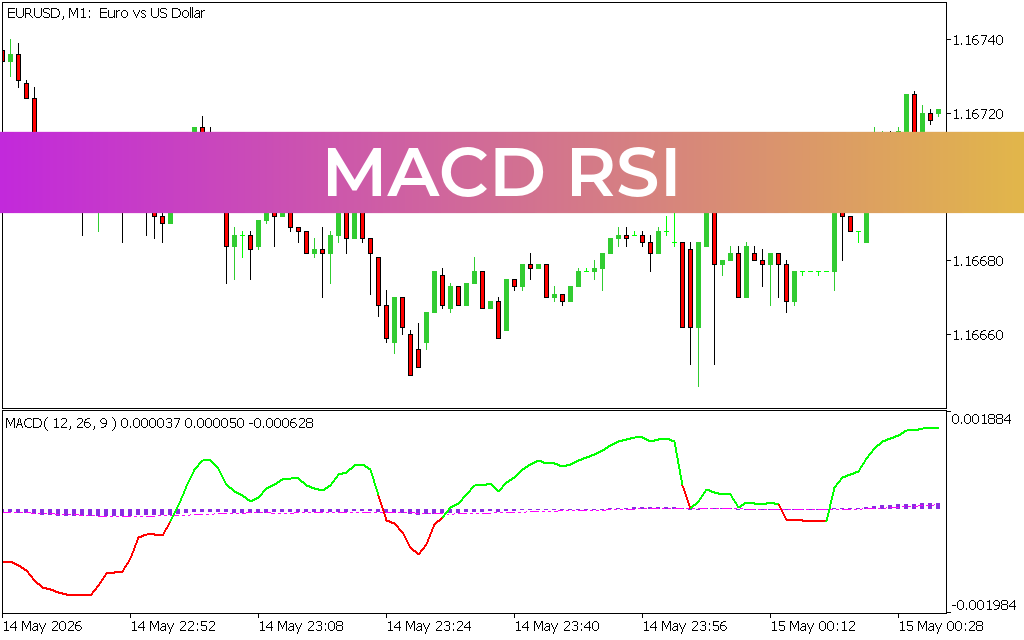
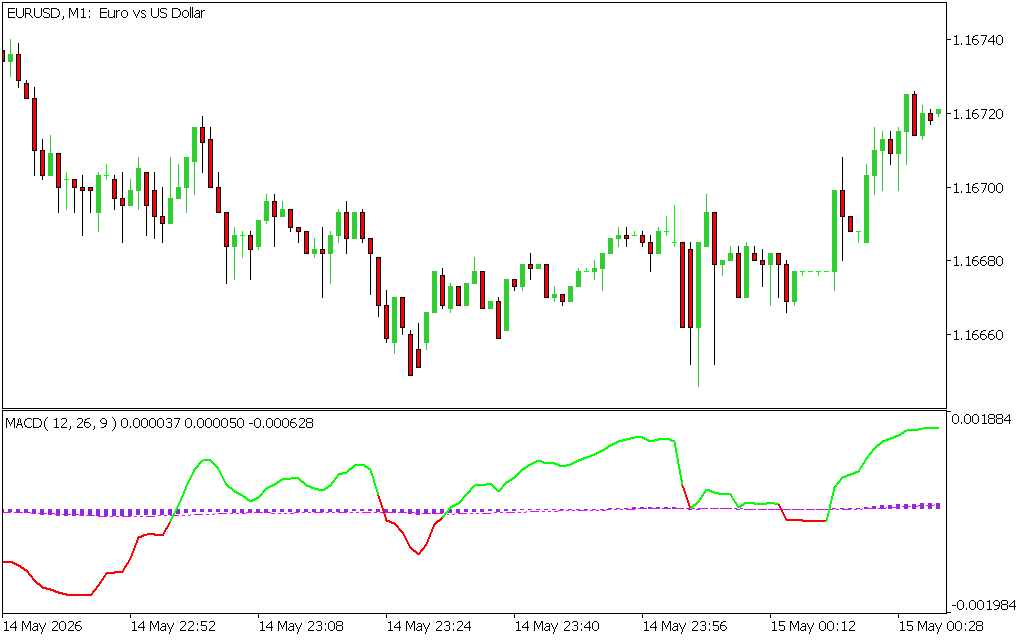
On the MT5 chart, the indicator displays as a dynamic, color-coded oscillator line fluctuating around a central zero baseline:
- Green Line sections: Indicate that both MACD trend momentum and RSI relative strength are aligned upward, signaling strong bullish market conditions.
- Red Line sections: Indicate that both indicators have aligned downward, confirming aggressive bearish control.
- Purple Histogram & Dotted Thresholds: Map out structural baseline crossings and extreme volatility zones, letting you know exactly when the market is entering overextended territory.
Key Trading Strategies with MT5 MACD RSI
By combining momentum and trend validation, this hybrid tool gives traders highly reliable, objective entry and exit parameters:
1. Dual-Momentum Zero Line Crossings
The cleanest trade entries occur when the indicator line shifts color and crosses the central zero baseline.
- Bullish Trigger: When the oscillator line turns green and climbs above the 0.00 level, it confirms that short-term momentum has surpassed long-term averages alongside a rising RSI. This marks a high-probability buy signal.
- Bearish Trigger: When the line transitions to red and drops below the zero level, it reveals that institutional selling pressure is expanding, validating a strong short entry.
2. Advanced Divergence Identification
Divergence trading remains one of the most reliable leading indicators for major market reversals. Because this indicator tracks both structural moving averages and relative price velocity, it highlights exceptionally clean divergences. If the price makes a higher high, but the MACD RSI line prints a clear lower high, it warns that the bullish rally is completely out of fuel, alerting traders to tighten stop-losses or prepare for a sharp counter-trend short trade.
Optimized for Multi-Asset Analysis on MT5
The MetaTrader 5 engine allows the MACD RSI indicator to run complex double-smoothing algorithms effortlessly across multiple asset classes—including Forex pairs, indices, crypto, and commodities. Whether you are Scalping on a 1-minute chart or swing trading on a 4-hour timeframe, it provides clean visuals with zero processing lag. By acting as an all-in-one trend filter and moment
3 Downloads
Last Update:
May 16, 2026 14:44 PM
Published:
Jan 21, 2026 11:29 AM
Category: