Decoding Market Strength with the Price Volume Trend (PVT) Oscillator
In technical analysis, Price Action tells you where the market is going, but volume tells you how much "fuel" is in the tank. The Price Volume Trend (PVT) Oscillator is a sophisticated Momentum Indicator that combines these two critical data points to help traders identify the underlying strength of a trend. While many traders rely solely on price-based oscillators, the PVT provides a deeper look into the institutional money flow that truly drives market direction.
What is the Price Volume Trend Oscillator?
The Price Volume Trend Indicator is similar to the On-Balance Volume (OBV) in that it tracks cumulative volume. However, the PVT is more nuanced. While OBV adds or subtracts the total volume of a period based on whether the close was higher or lower, PVT only adds a percentage of the volume based on the relative price change.
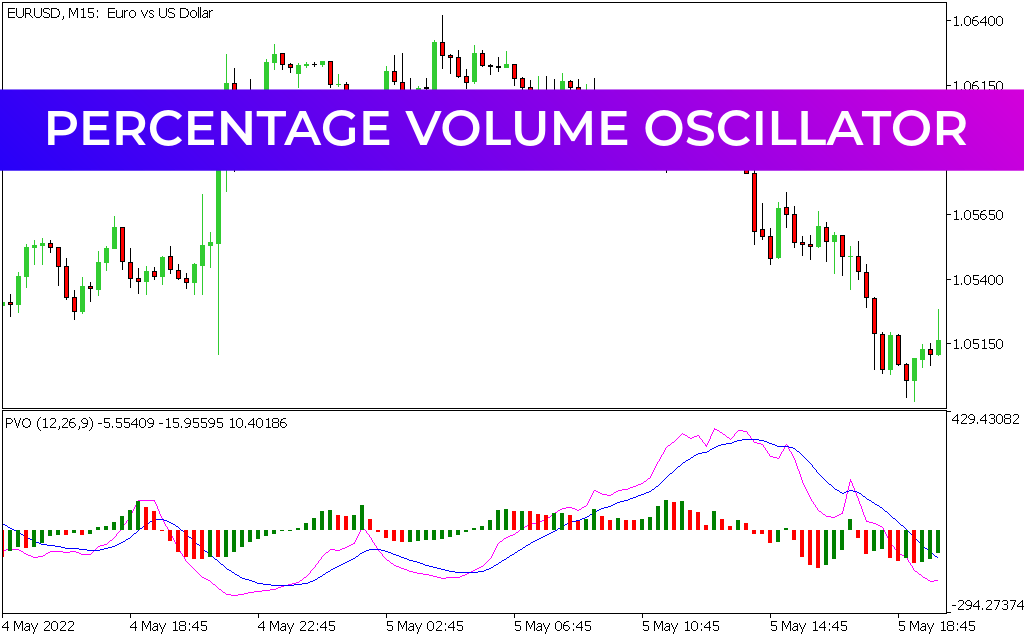
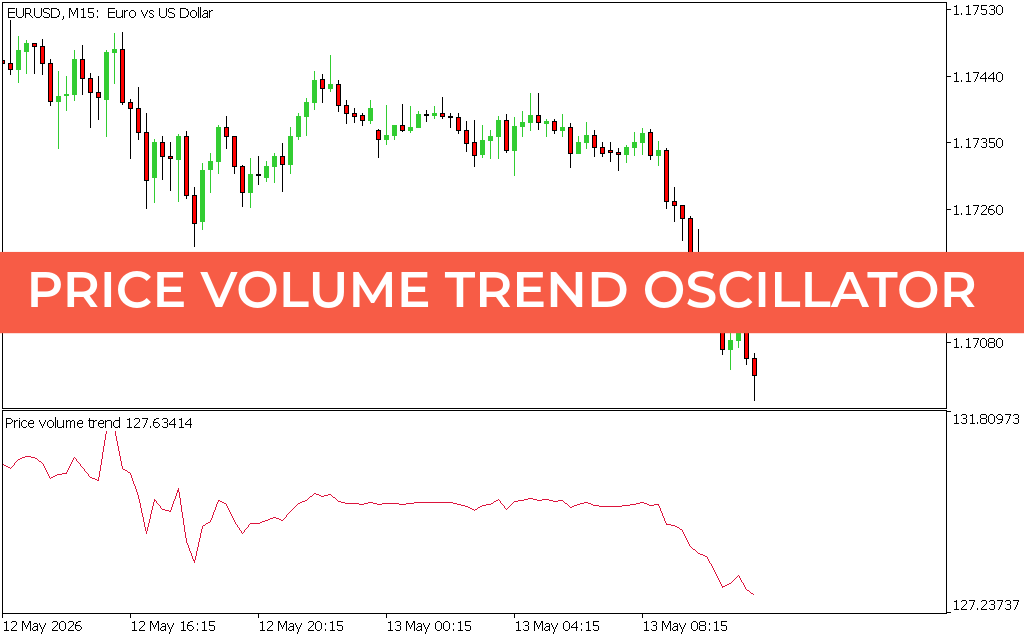
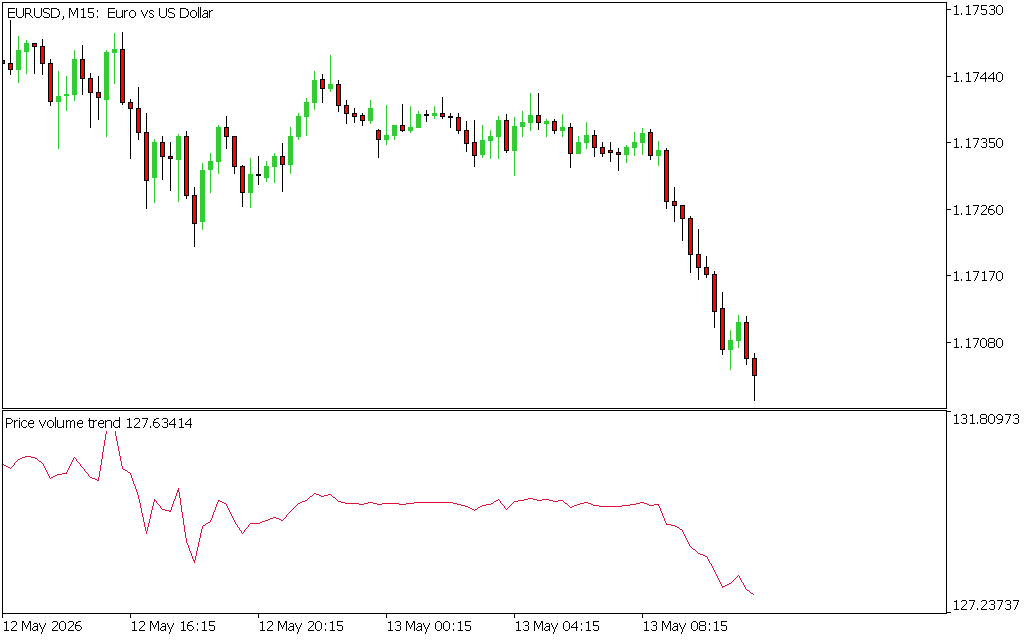
If price increases by $1\%$, only $1\%$ of the volume is added to the cumulative total. This adjustment ensures that the indicator reflects the intensity of the price movement. As seen on the EURUSD M15 chart, the PVT line closely mirrors the price trend but often acts as a leading indicator during periods of distribution or accumulation.
Key Trading Advantages
- Confirmation of Trend Strength: In a healthy uptrend, the PVT should be rising alongside price. If price is climbing but the PVT line is flat or falling, it suggests that the move is "thin" and lacks institutional backing, signaling a potential reversal.
- Spotting Divergences: One of the most powerful uses of the PVT is identifying divergence. If price hits a new lower low—as seen in the recent sharp drop on the provided EURUSD chart—but the PVT starts to flatten out or tick upward, it may indicate that selling pressure is exhausted and a bounce is imminent.
- Breakout Validation: When price breaks out of a consolidation zone, traders look to the PVT for confirmation. A breakout accompanied by a sharp spike in the PVT line suggests a high-probability move, as it confirms that significant capital is entering the market.
Integrating PVT into Your Strategy
The PVT Oscillator is exceptionally effective for day traders on lower timeframes like the M15. Because it accounts for volume, it helps filter out "fakeouts" that often occur during low-liquidity sessions. In the attached chart, the aggressive downward slope of the PVT line confirms the conviction behind the bearish move, warning traders against attempting to "catch the falling knife" too early.
To maximize accuracy, combine the PVT with Support And Resistance levels or a secondary momentum oscillator. When volume-based conviction aligns with structural price levels, you have a high-confluence setup that professional traders look for.
Conclusion
The Price Volume Trend Oscillator is a vital tool for any trader who wants to understand the "why" behind price movements. By weighting volume according to price performance, it offers a more precise view of market conviction than standard volume bars. Incorporate the PVT into your trading toolkit today to start identifying high-quality setups backed by real market participation.
1 Download
Last Update:
May 13, 2026 13:57 PM
Published:
Jan 23, 2026 10:53 AM
Category: