Maximize Trend Precision with the MAMy Indicator for MT5
In the fast-evolving financial markets of 2026, the ability to filter market noise while maintaining responsiveness to Price Action is the hallmark of a professional trading strategy. The MAMy Indicator for MT5 is a sophisticated technical utility designed to provide traders with a clear, mathematical perspective on trend momentum and price velocity. By utilizing an optimized dual-line crossover system, MAMy allows you to identify high-probability entry and exit points with institutional-grade accuracy.
The Science of MAMy Momentum Tracking
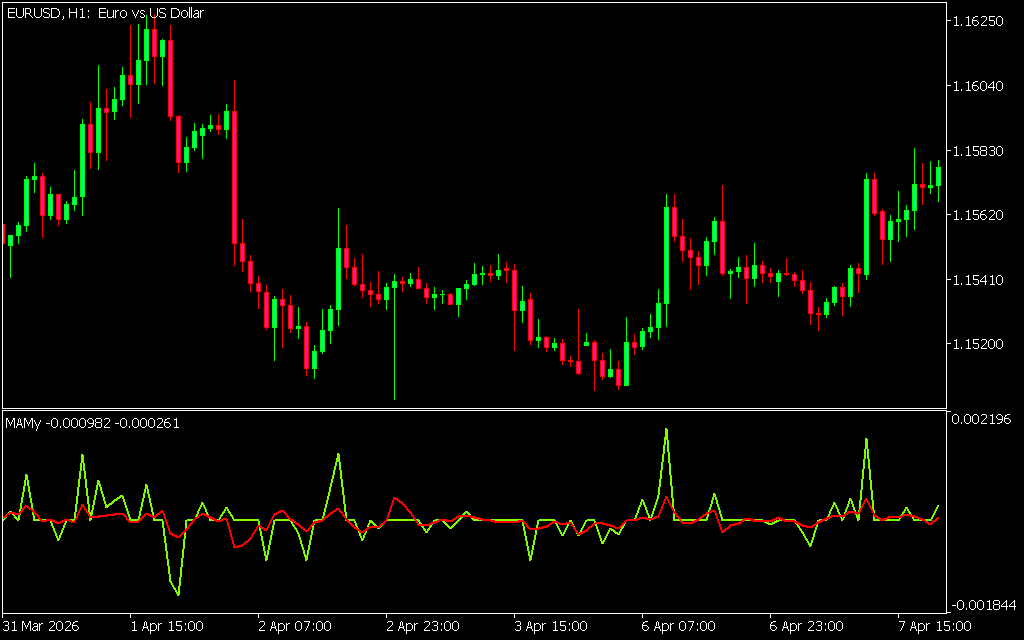
The MAMy Indicator operates as a momentum-based oscillator in a dedicated sub-window, ensuring your primary price chart remains clean and focused. Unlike traditional moving averages that often suffer from significant lag, the MAMy algorithm is tuned to react to the "energy" behind price movements. This makes it an invaluable tool for traders who specialize in capturing explosive breakouts or identifying early signs of trend exhaustion.
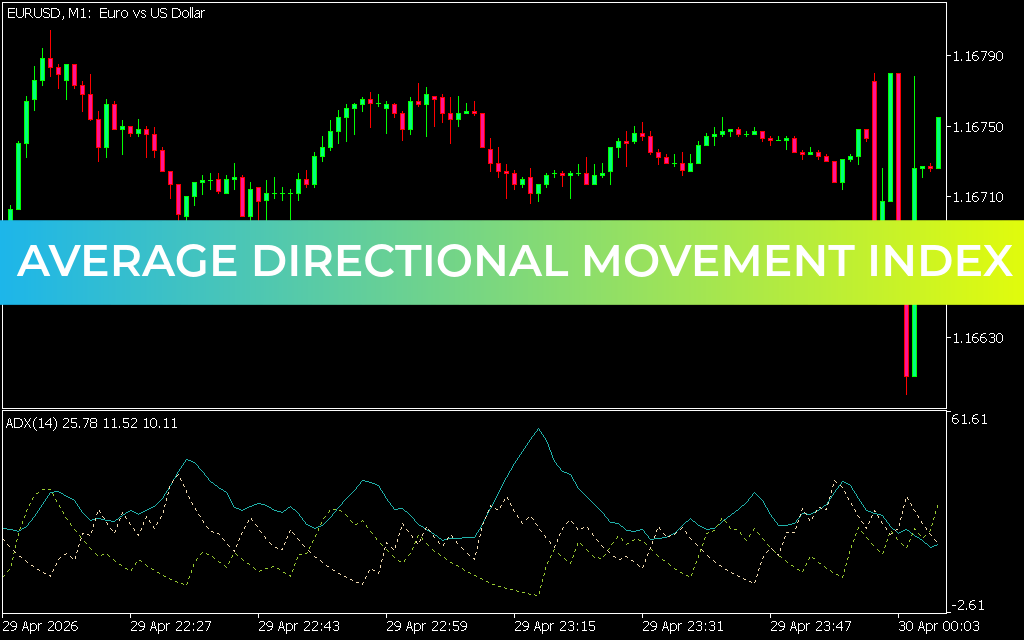
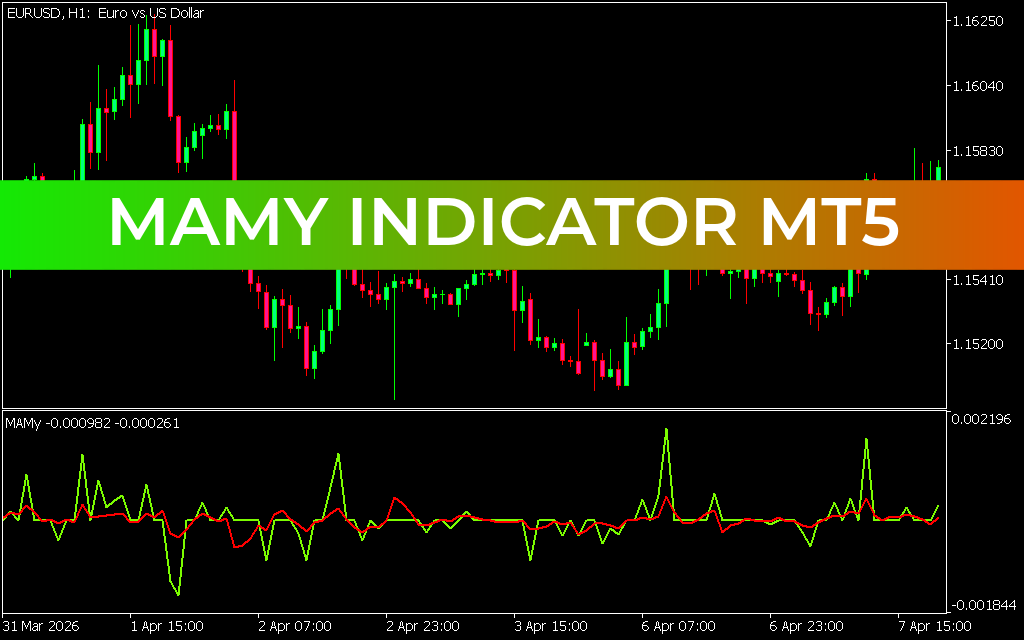
As demonstrated in the EUR/USD 1-hour (H1) chart, the indicator utilizes two primary components:
- The Green Signal Line: This is the fast-acting component of the indicator. It tracks real-time price fluctuations and serves as the primary driver for trade signals.
- The Red Baseline: This smoothed line represents the medium-term trend. It acts as a filter, helping traders distinguish between meaningful market shifts and temporary volatility.
Identifying High-Probability Trade Signals
The core functionality of the MAMy Indicator revolves around the interaction between the green and red lines. These crossovers provide objective, data-driven signals that remove the emotional guesswork from trading:
- Bullish Momentum: When the green line crosses above the red baseline, it signals that upward momentum is accelerating. This is often the precursor to a sustained bullish trend, providing a clear "buy" signal.
- Bearish Momentum: When the green line drops below the red baseline, it indicates that selling pressure is taking control. Traders can use this as a "sell" signal or a warning to exit long positions.
- Peak Volatility: Sharp spikes in the green line away from the red baseline indicate extreme market conditions, which can be used to identify overbought or oversold zones for mean-reversion strategies.
Optimized for Professional MT5 Setups
Modern trading requires tools that are as visually efficient as they are technically accurate. The MAMy Indicator is perfectly optimized for professional dark mode interfaces. The high-contrast green and red signal lines are designed for instant readability, allowing for split-second decision-making during high-impact news events or the opening of major global sessions.
Why Choose MAMy for Your MT5 Terminal?
In 2026, retail traders must use every available tool to level the playing field against institutional algorithms. The MAMy Indicator provides that edge by focusing on the relationship between price speed and trend stability. Whether you are a scalper looking for quick intraday pivots on the 5-minute chart or a swing trader managing positions on the H1 timeframe, MAMy offers the versatility and precision required for consistent success.
Transform your MetaTrader 5 experience by integrating the MAMy Indicator into your workflow. By following the mathematical reality of trend momentum, you position yourself to trade with the confidence of a professional.
7 Downloads
Last Update:
Apr 19, 2026 21:50 PM
Published:
Feb 03, 2026 19:24 PM
Category: