Capturing Momentum Shifts with the Percentage Price Oscillator
Traders searching for reliable momentum indicators often rely on tools that analyze moving average relationships. While the Moving Average Convergence Divergence (MACD) remains a staple in technical analysis, it has a notable limitation: its readings are expressed in absolute currency values, making it difficult to compare across different asset classes or highly volatile price regimes. To overcome this limitation, advanced technical analysts turn to the Percentage Price Oscillator (PPO).
As a highly versatile momentum tool for the MetaTrader platform, the Percentage Price Oscillator standardizes momentum tracking, making it an exceptional utility for scalpers, day traders, and swing traders alike.
What is the Percentage Price Oscillator?
The Percentage Price Oscillator is a technical indicator that measures the difference between two Exponential Moving Averages (EMAs) relative to the longer EMA. The standard setting typically utilizes a 9-period fast EMA and a 26-period slow EMA.
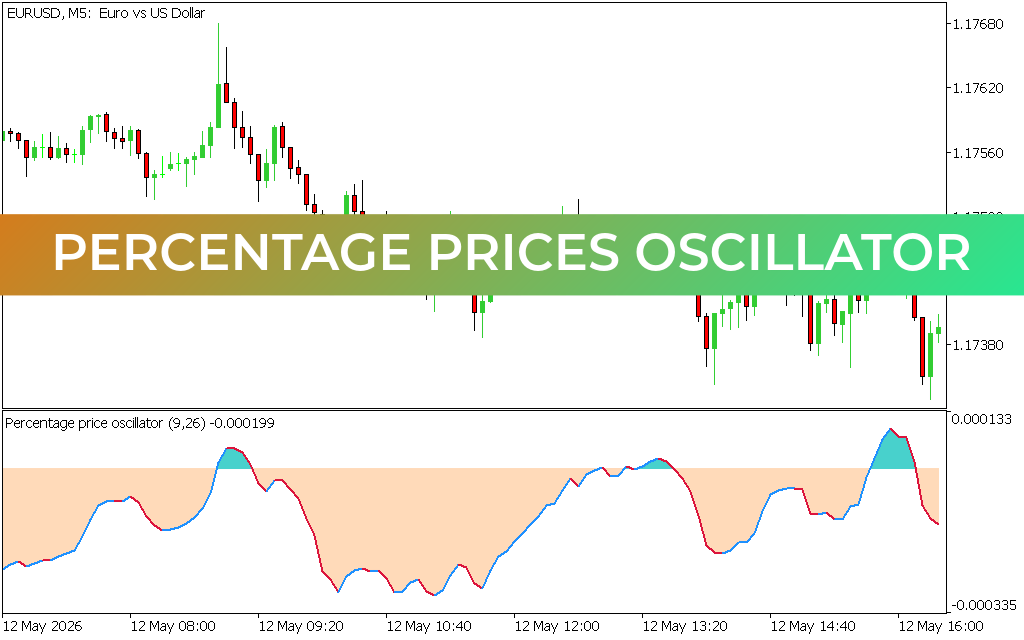
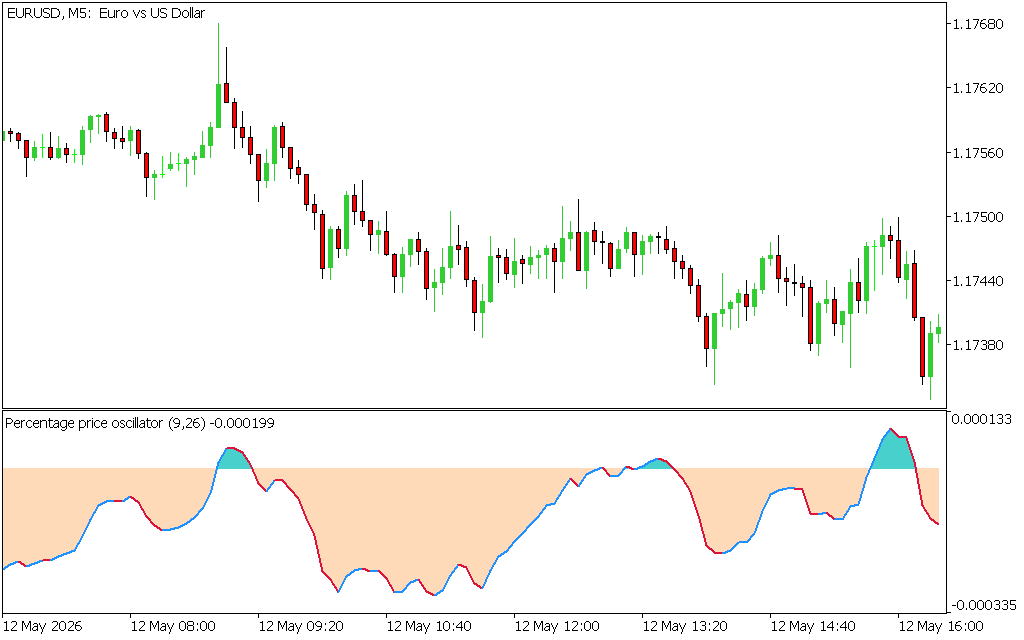
Unlike the MACD, which simply subtracts the slow EMA from the fast EMA, the PPO calculates this difference as a percentage. This percentage-based approach allows traders to objectively evaluate momentum across varied asset classes, currency pairs, or vastly different time horizons. On a chart—such as the 5-minute (M5) setup—the PPO is displayed in a separate sub-window as a smoothly undulating line that turns blue during bullish shifts and red during bearish contractions, occasionally filling peaks and troughs to highlight extreme momentum surges.
Key Technical Strategies and Applications
Implementing the Percentage Price Oscillator into your trading framework offers a highly refined approach to trend and momentum tracking:
1. Zero-Line Crossovers
The zero line acts as a major indicator pivot. When the PPO line crosses above the zero line, it confirms that short-term momentum is outpacing long-term momentum, signaling a potential buying opportunity. Conversely, a cross below the zero line indicates that sellers are gaining structural control, favoring short positions.
2. Momentum Divergence
One of the most potent setups involves trading divergences between Price Action and the PPO. If a currency pair like the EUR/USD makes a higher price high, but the PPO prints a lower high, it signals underlying bullish exhaustion. This divergence frequently serves as an early warning indicator for impending market reversals.
3. Standardized Peak Comparisons
Because the PPO values are percentage-bound, traders can analyze past market turning points to determine what percentage level represents an overextended market. Recognizing these historical overbought or oversold thresholds helps intraday traders avoid chasing extended trends right before a market retracement occurs.
Standardizing Your Trading Analysis
The Percentage Price Oscillator provides a significant upgrade over traditional momentum indicators by injecting mathematical standardization into your charting template. By delivering crystal-clear visual cues regarding momentum shifts and structural trend health, it allows you to trade with enhanced precision. Whether you are navigating rapid intraday scalps or long-term market trends, the PPO serves as an invaluable confirmation tool for your technical system.
1 Download
Last Update:
May 19, 2026 15:49 PM
Published:
Jan 19, 2026 19:58 PM
Category: