Mastering Market Momentum with the Corrected RSX Indicator
In the fast-paced world of Forex trading, the difference between a winning trade and a missed opportunity often comes down to the quality of your technical indicators. Standard momentum oscillators, like the classic Relative Strength Index (RSI), are staples in many trading systems. However, they are frequently criticized for being "noisy" or lagging during periods of high volatility. This is where the Corrected RSX (Relative Strength Quality Index) steps in as a sophisticated evolution designed for the modern trader.
What is the Corrected RSX?
The Corrected RSX is an advanced version of the traditional RSX, which itself is a "noise-free" version of the RSI. While a standard RSI can look jagged and produce numerous false signals, the RSX uses complex smoothing algorithms to provide a cleaner visual representation of market momentum without the lag typically associated with moving averages.
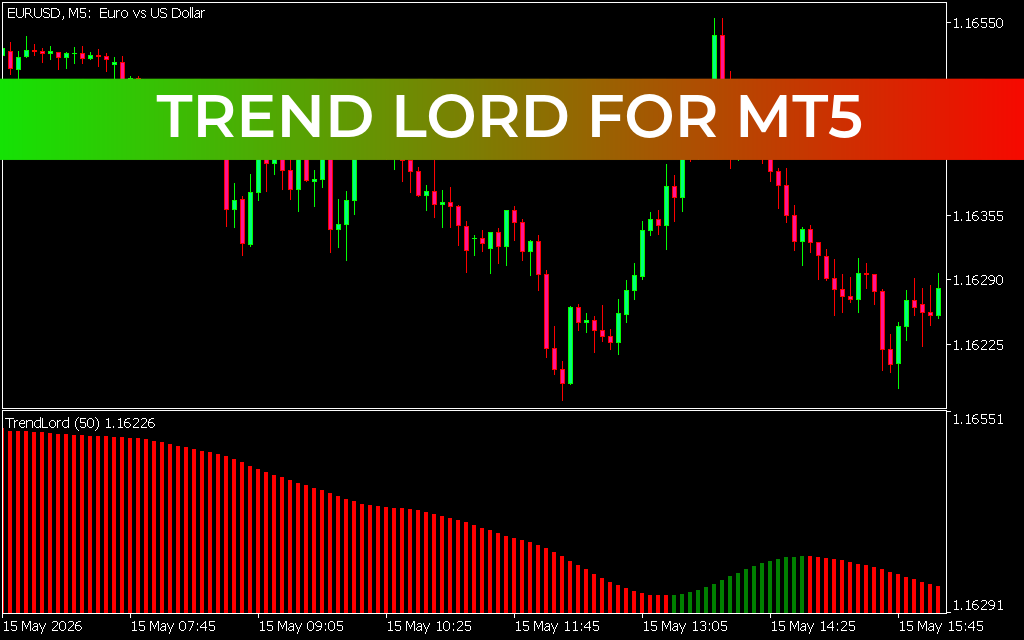
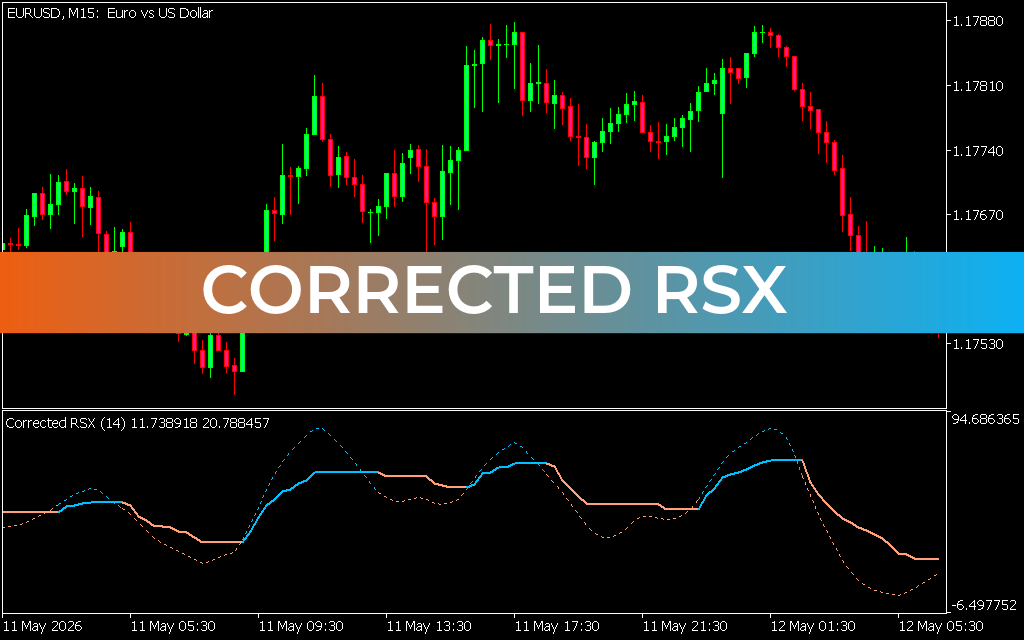
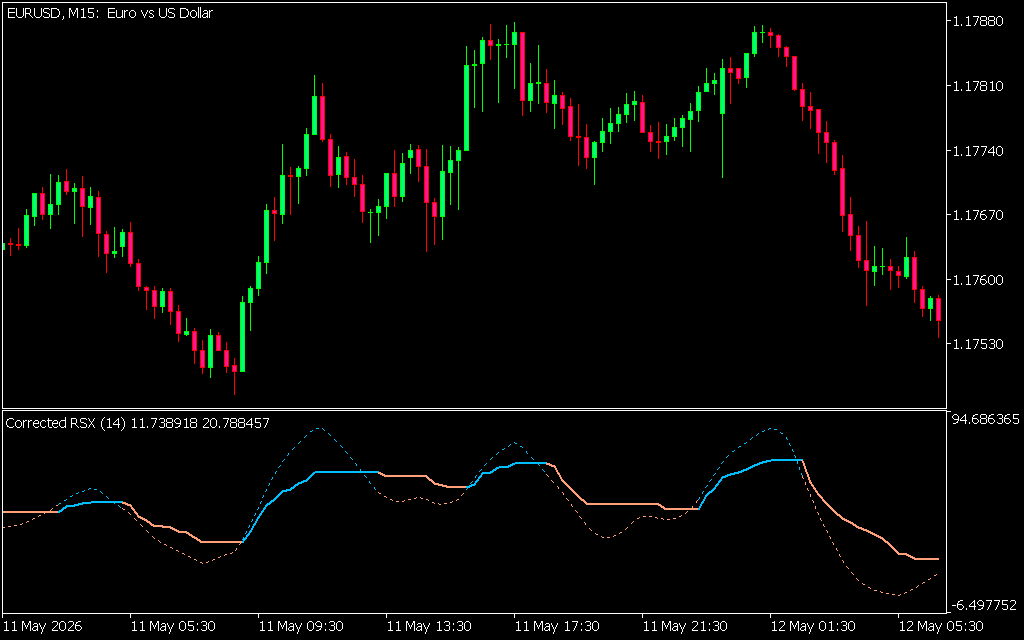
The "Corrected" version takes this a step further. It integrates statistical corrections to ensure the indicator remains responsive to Price Action while filtering out the market "chatter" that often triggers premature entries or exits. As seen on the EURUSD M15 chart, the Corrected RSX provides a fluid, color-coded line that transitions between bullish (blue) and bearish (orange) phases, allowing traders to identify trend shifts at a glance.
Key Benefits for Day Traders
- Reduced Market Noise: The primary advantage of the Corrected RSX is its smoothness. By eliminating the erratic spikes found in standard oscillators, traders can maintain their composure during minor price retracements, staying in profitable trends longer.
- Zero-Lag Momentum Tracking: Unlike simple moving averages that drag behind price, the Corrected RSX utilizes a sophisticated mathematical approach to ensure the indicator turns as soon as the momentum shifts.
- Visual Clarity: The color-coded transitions act as a primary filter. When the line turns blue, the momentum is firmly with the bulls; when it shifts to orange, the bears have taken control. This visual shorthand is invaluable for scalpers and day traders operating on lower timeframes like the M15.
How to Trade with Corrected RSX
To maximize the effectiveness of the Corrected RSX, it should be used as part of a confluence-based strategy. For instance, in the provided chart, we see the indicator reaching extreme highs (overbought) or lows (oversold) before changing color.
- Bullish Setup: Look for the indicator to bottom out near the lower boundary. Once the line turns blue and begins to slope upward, it signals a high-probability long entry, especially if aligned with support levels on the price chart.
- Bearish Setup: Conversely, when the indicator reaches the upper peaks and turns orange, it signals that the upward momentum is exhausted, providing a signal to short the market or tighten stop-losses on long positions.
Conclusion
The Corrected RSX is more than just a smoothing tool; it is a precision instrument for traders who value clarity and timing. By stripping away the noise and focusing on the core velocity of price movement, it empowers you to trade with confidence. Whether you are a seasoned professional or a developing trader, adding the Corrected RSX to your MetaTrader toolkit can significantly refine your execution and market analysis.
Last Update:
May 13, 2026 13:49 PM
Published:
Jan 23, 2026 11:08 AM
Category: