Maximizing Multi-Timeframe Precision: The Stoch RSI Indicator for MT5
In technical analysis, relying on a single momentum oscillator can often leave traders trapped on the wrong side of a fast-moving market. Popular tools like the Relative Strength Index (RSI) excel at defining overall Trend Strength but can frequently remain in overbought or oversold territories for extended periods without giving clear execution signals. To bridge this gap, quantitative analysts developed the Stoch RSI indicator—a hybrid momentum powerhouse designed to increase sensitivity and pinpoint exact structural reversals on MetaTrader 5 (MT5).
What is the Stoch RSI Indicator?
The Stoch RSI is an oscillator that applies the mathematical formula of the Stochastic calculation directly to the raw data of the RSI, rather than to the asset's closing price. By measuring the relative position of the RSI within its designated historical range, the Stoch RSI transforms a slow-moving trend line into a hyper-responsive indicator that fluctuates rapidly between extreme boundaries.
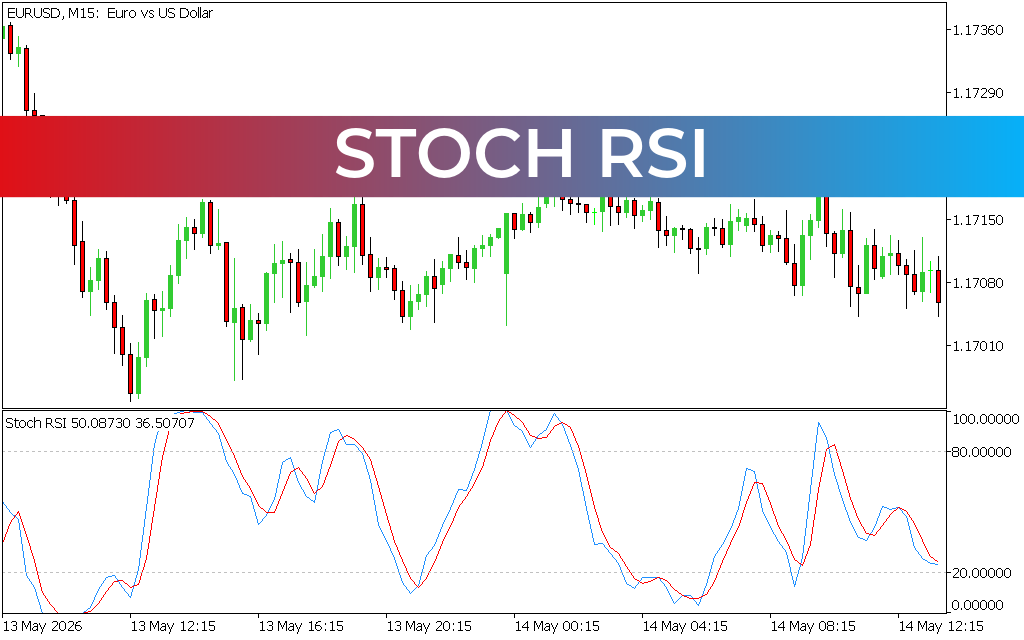
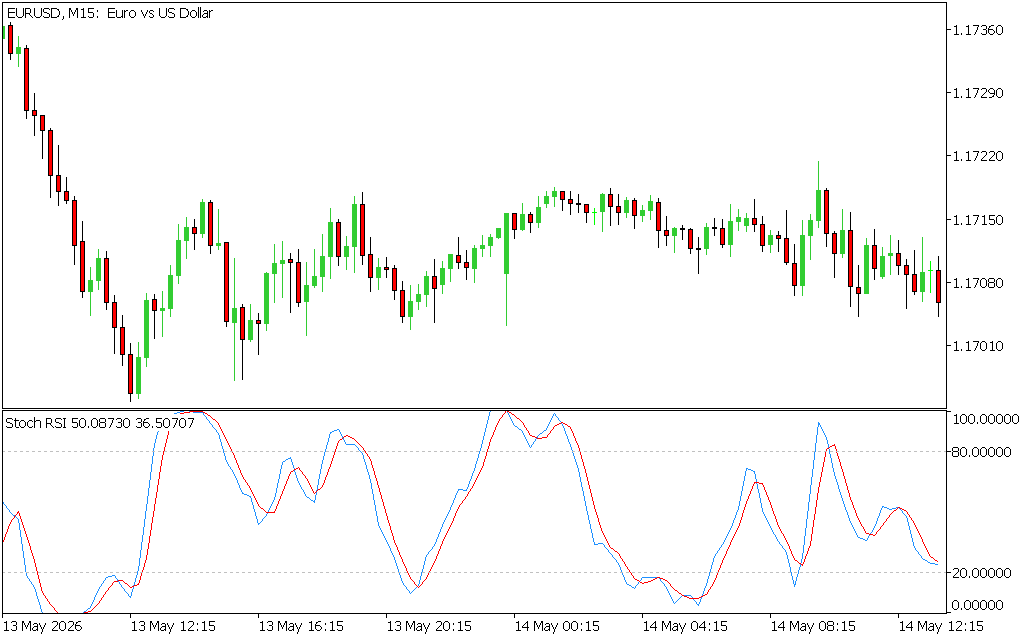
As demonstrated in the EURUSD M15 chart, the indicator plots two interacting lines within a separate sub-window:
- The Fast %K Line (Blue): Tracks immediate structural momentum.
- The Slow %D Line (Red): Acts as a smoothed signal moving average to filter out market noise.
The panel ranges between an absolute scale of $0.00$ to $100.00$, utilizing two crucial internal horizontal milestones: the 80.00 Overbought threshold and the 20.00 Oversold threshold.
High-Probability Trading Strategies with Stoch RSI
Because the Stoch RSI combines the best features of two classic indicators, it offers highly accurate tactical trade setups for MT5 users:
- Overextended Signal Crossovers: When both lines pierce beyond the 80.00 ceiling or below the 20.00 floor, the asset is mathematically overextended. As shown on the M15 chart, a clean bearish crossover where the blue line drops below the red line while exiting the 80.00 zone provides an aggressive, high-probability short signal right at the beginning of an intraday decline.
- Trend-Following Re-entries: During a robust daily trend, the Stoch RSI can be used to buy minor pullbacks. For example, in an established uptrend, waiting for the indicator lines to drop into the oversold region below 20.00 and cross upward allows you to enter the market at an institutional discount.
- Momentum Centerline Breaks: The 50.00 axis serves as a dynamic pivot point for buyers and sellers. A sharp break above the centerline confirms accelerating bullish expansion, while a decisive plunge below 50.00 indicates that bears have seized control of the near-term price structure.
Optimized for the High-Speed MT5 Terminal
The advanced multi-threaded architecture of MetaTrader 5 is perfectly suited to handle the dual-layered mathematical array of the Stoch RSI. The indicator processes complex algorithmic arrays across multiple timeframes simultaneously without lagging your execution terminal. This real-time synchronization ensures that the lines update instantly at the close of every candlestick, giving scalpers and day traders a clear execution edge.
Conclusion
The Stoch RSI indicator for MT5 upgrades your chart analysis by injecting precision into momentum tracking. By revealing exactly where the RSI is turning within its own cycle, it removes the guesswork from traditional oscillator trading. Add this tool to your MT5 terminal today to refine your market entries and exits.
3 Downloads
Last Update:
May 16, 2026 03:18 AM
Published:
Jan 21, 2026 13:48 PM
Category: