Elevate Your Trend Following with the EMA to SMA MACD Indicator
Trading standard momentum oscillators in fast-moving financial markets can often expose retail traders to significant lagging issues. Traditional Moving Average Convergence Divergence (MACD) indicators rely entirely on Exponential Moving Averages (EMAs), which can sometimes react too aggressively to short-term spikes, creating false entry signals. For traders executing rapid trend-following or Scalping setups on major currency pairs like the EUR/USD, refining this calculation is essential. The EMA to SMA MACD indicator provides a uniquely balanced structural twist to solve this analytical dilemma.
What is the EMA to SMA MACD Indicator?
The EMA to SMA MACD is an upgraded variation of the classic momentum tool tailored for MetaTrader platforms. While standard setups compute the difference between two exponential averages, this technical indicator introduces a structural hybrid model: it tracks the relationship between an Exponential Moving Average (EMA) and a Simple Moving Average (SMA).
Typically, the indicator compares a fast EMA (such as a 12 or 26-period lookback) directly against a slower SMA baseline. By using an SMA for the slower line, the tool anchors your analysis to a steady, solid reflection of true market value, while the fast EMA ensures the indicator remains highly sensitive to immediate price updates. The resulting divergence is plotted as a clean histogram with a custom signal line overlay.
Key Visual Features and Structural Benefits
- Refined Signal Accuracy: By combining the rapid responsiveness of an EMA with the stable filtering power of an SMA, the indicator minimizes premature crossover triggers during choppy, sideways consolidation.
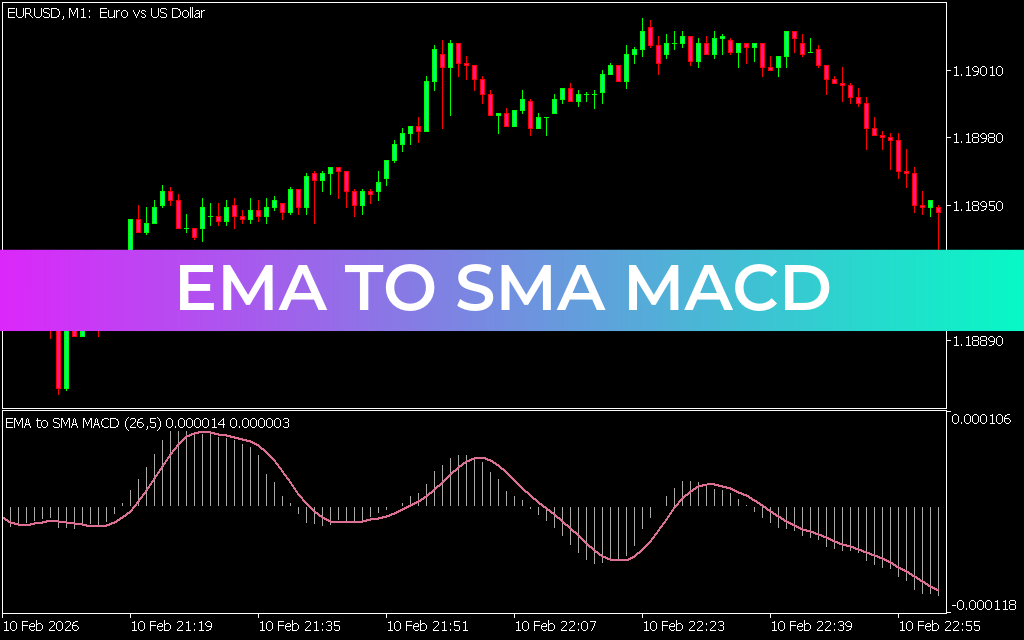
- Proportional Histogram Blocks: The vertical histogram lines measure the widening or narrowing distance between the two underlying moving averages. As demonstrated on ultra-short timeframes like the 1-minute (M1) chart, these bars highlight acceleration points perfectly.
- Smooth Signal Line Tracking: The indicator includes a highly calibrated signal line (shown in pink) that acts as a definitive mathematical trigger for confirming immediate momentum reversals.
- Minimalist Sub-Window Display: By operating entirely in its own dedicated panel below the primary workspace, it leaves your core candlestick charts completely clear for mapping raw Price Action or key order blocks.
How to Trade with EMA to SMA MACD
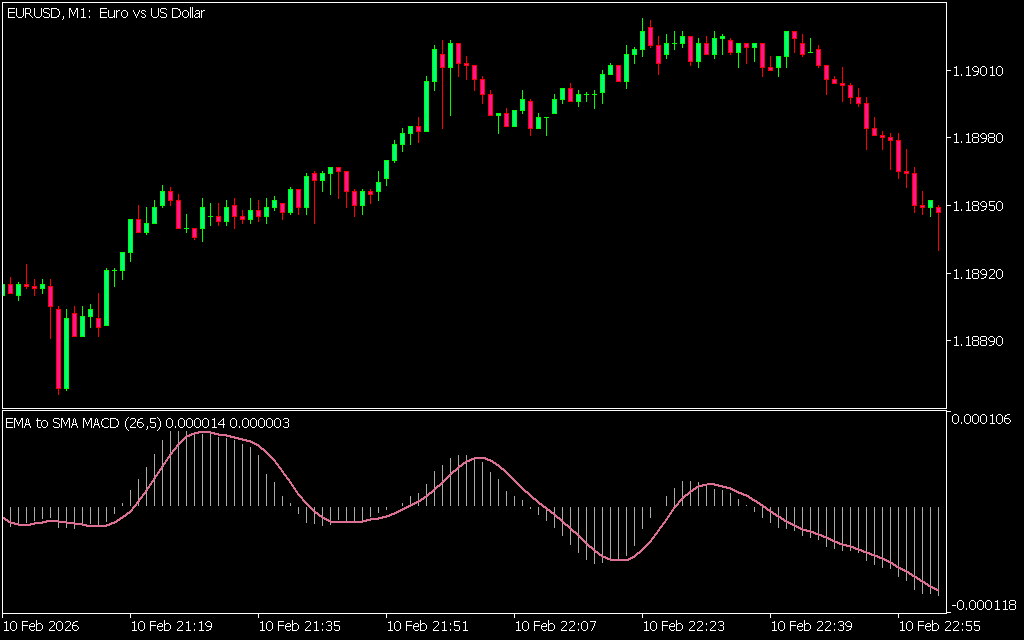
Utilizing this tool effectively requires monitoring the interactions between the center zero-line, the histogram bars, and the overlay signal line.
- Executing Long Entries: Watch for the pink signal line to cross out of the bottom of the histogram bars and move upward. When the histogram bars cross completely above the 0.00 zero-line baseline, a bullish trend acceleration is confirmed. Enter a buy position to ride the building upward momentum.
- Executing Short Entries: Conversely, when the pink signal line rolls over from a peak and the histogram bars collapse below the 0.00 threshold, sellers have taken control of the market. Execute a short entry with a protective stop-loss placed just above the recent local swing high.
Equip your charting terminal with the EMA to SMA MACD indicator today to enjoy cleaner, more reliable trend filtering.
Last Update:
May 19, 2026 16:34 PM
Published:
Jan 19, 2026 13:48 PM
Category: