Master the Flow of Money with the MFI Indicator for MT4
In the world of technical analysis, Price Action is only half of the story. To truly understand market sentiment, you need to look at the volume fueling those price movements. The MFI (Money Flow Index) Indicator is a powerful momentum oscillator that integrates both price and volume to measure the "enthusiasm" behind a trend. Often referred to as the "Volume-Weighted RSI," the MFI is an essential tool for identifying overextended markets and potential trend reversals.
What is the Money Flow Index?
The MFI is a technical oscillator that moves between 0 and 100. Unlike the Relative Strength Index (RSI), which only accounts for price changes, the MFI incorporates tick volume to determine whether money is flowing into or out of a specific asset.
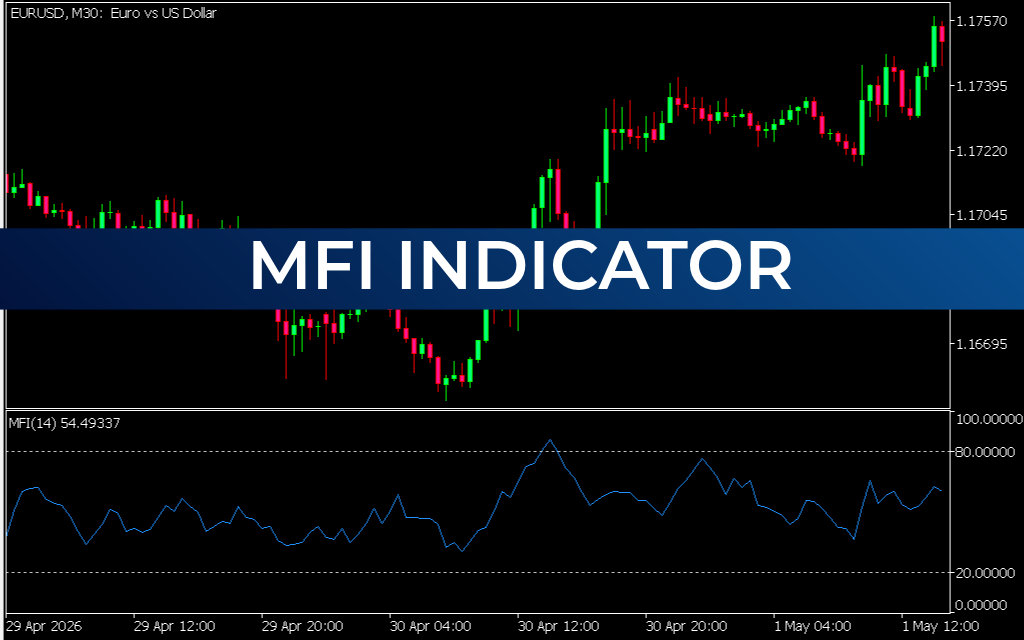
As shown in the EUR/USD M30 chart, the indicator appears in a separate window below the main price action. It features a blue signal line that oscillates between key thresholds. When the MFI rises, it indicates a surge in "Positive Money Flow" (buying pressure); when it falls, it signals "Negative Money Flow" (selling pressure).
Key Features and Trading Signals
- Overbought and Oversold Levels: The MFI uses the 80 and 20 levels as primary benchmarks. A reading above 80 suggests the market is overbought and a pullback may be imminent. Conversely, a reading below 20 indicates an oversold condition where buyers might step in.
- Divergence Analysis: One of the MFI's most potent signals is divergence. If the price makes a new high but the MFI makes a lower high, it suggests that the upward move lacks volume support and a reversal is likely.
- Centerline Crossovers: The 50 level acts as the indicator's "equilibrium." A cross above 50 signals that bullish sentiment is gaining the upper hand, while a cross below 50 indicates bearish dominance.
- Volume-Price Confirmation: Because it uses volume, the MFI helps traders distinguish between a "healthy" trend and a "exhausted" one. A price breakout accompanied by an MFI surge is much more likely to be genuine than one occurring on low money flow.
Strategic Application
The MFI Indicator is exceptionally versatile. Scalpers on the M30 timeframe can use it to catch quick swings as the indicator bounces off the 20 and 80 extremes. For swing traders, the MFI serves as a vital filter: if you are looking to go long, seeing the MFI rise from oversold territory provides the institutional "confirmation" needed to enter with confidence.
By monitoring the intensity of money flow, you can stay ahead of the herd. Whether you are trading Forex, stocks, or commodities, the MFI provides a transparent look at the Supply And Demand dynamics that drive every market move.
1 Download
Last Update:
May 11, 2026 21:21 PM
Published:
Jan 24, 2026 13:38 PM
Category: