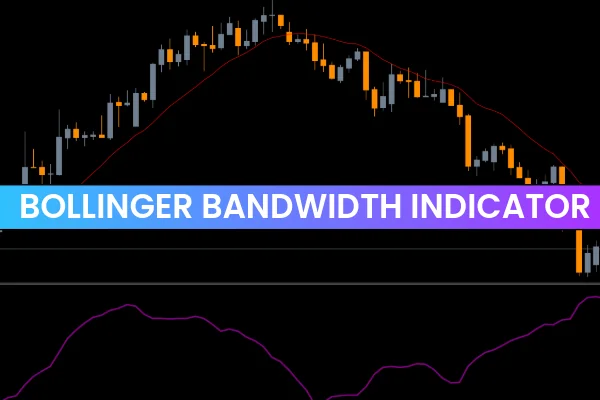
The Bollinger Bandwidth Indicator for MT5 is a powerful tool designed to measure market volatility using the classic Bollinger Bands. Unlike standard Bollinger Bands, which track price levels, the Bollinger Bandwidth focuses on the difference between the upper and lower bands. By doing so, it helps traders anticipate upcoming price movements and identify periods of low or high volatility.
The indicator is displayed as an oscillator in a separate window below the price chart. Its values increase when price volatility rises and decrease when volatility is low. This makes it a versatile tool for intraday traders, swing traders, and scalpers alike.
How the Bollinger Bandwidth Indicator Works
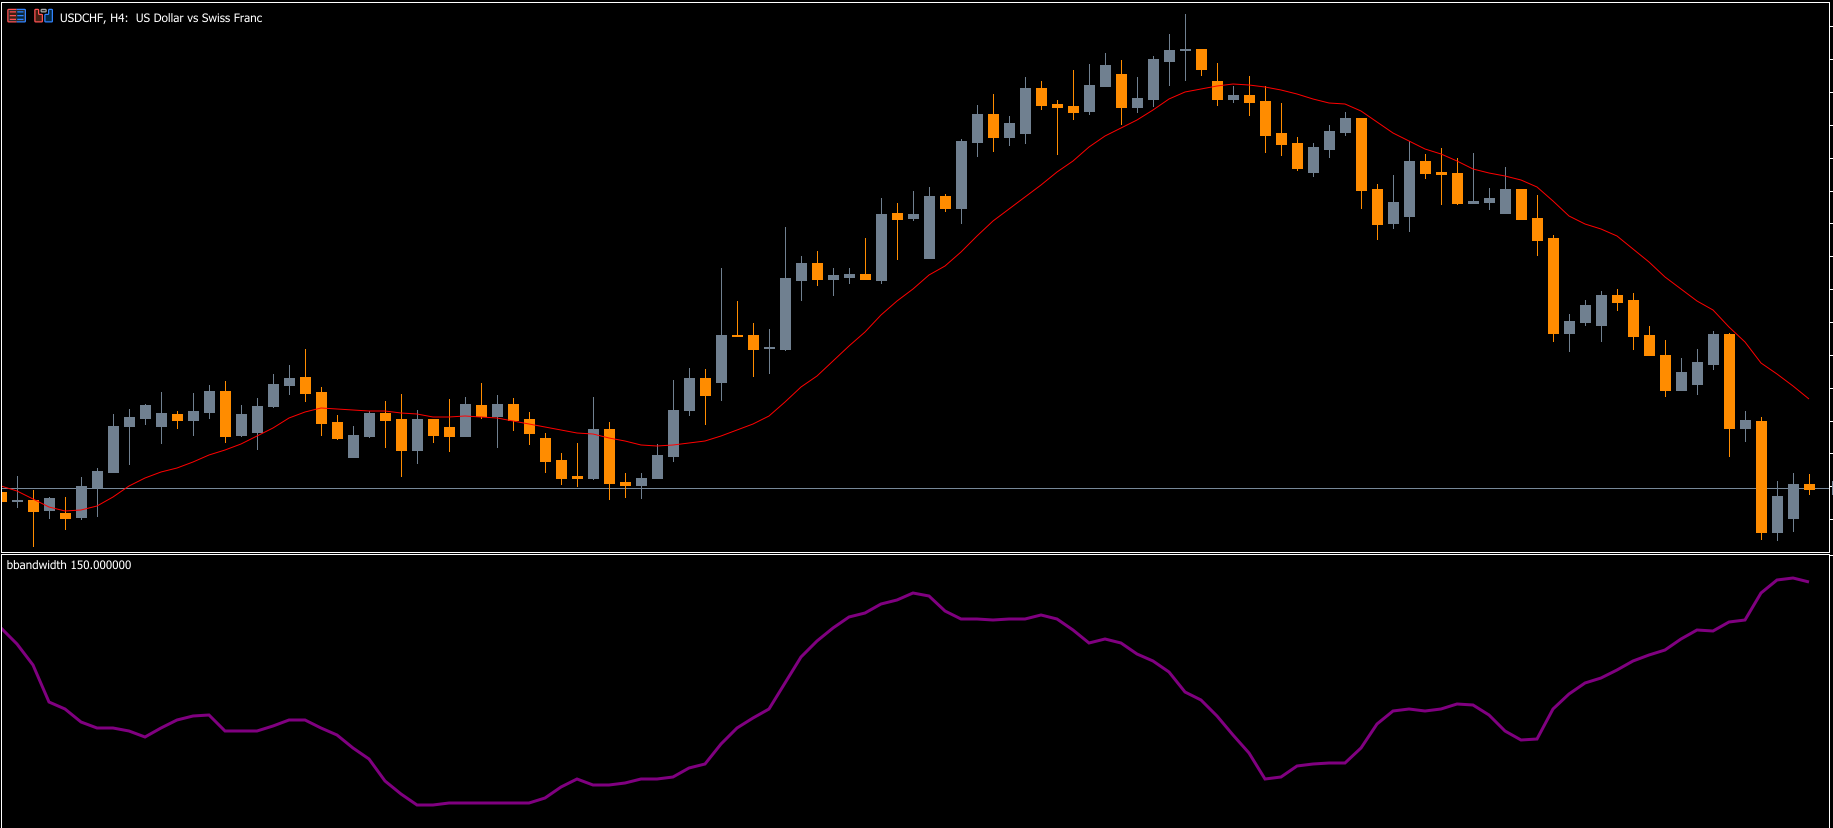
The Bollinger Bandwidth indicator measures the width between the upper and lower Bollinger Bands.
High values → price is volatile, wide bands
Low values → price is consolidating, narrow bands
When the bands narrow, it typically signals an upcoming breakout or significant market movement. Conversely, when the oscillator remains steady at low levels, it shows that the market is in a period of low volatility and may be preparing for a directional move.
Traders should remember that the indicator does not provide market direction; it only signals potential changes in volatility. Therefore, it is best used alongside other trend indicators, support/resistance levels, or Price Action patterns to confirm trade entries.
Trading Setups Using Bollinger Bandwidth
The indicator provides several strategies to help forex traders anticipate market moves:
Breakout Anticipation
Narrowing Bollinger Bands indicate that volatility is low.
Traders prepare for a breakout by waiting for price action confirmation.
Buy or sell depending on whether the price breaks above or below the bands.
Double Top and Double Bottom Patterns
Identify double tops in the Bollinger Bandwidth oscillator → potential sell setup with stop loss above the top.
Identify double bottoms → potential buy setup with stop loss below the bottom.
Exits should be based on your risk/reward ratio rather than a preset target.
Divergence Strategy
Observe the oscillator for divergence with the price chart.
Divergence indicates that volatility is increasing or decreasing, signaling potential trade opportunities.
Traders can draw trendlines on the oscillator to track momentum changes.
Benefits of Using Bollinger Bandwidth for MT5
Helps anticipate market volatility before major price moves
Works on all timeframes: intraday (M1, M5, H1) and long-term (daily, weekly, monthly)
Suitable for both novice and experienced traders
Can be combined with other indicators like trendlines, moving averages, or price action techniques
Simple to interpret via an oscillator format
The indicator allows traders to time entries and exits more effectively by monitoring volatility changes. When volatility increases, new trading opportunities often arise.
Conclusion
The Bollinger Bandwidth Indicator for MT5 is a must-have tool for forex traders who rely on the classic Bollinger Bands. It provides a measure of market volatility, helping traders anticipate breakout moves and adjust their strategy accordingly. While it does not signal trend direction, it works perfectly when combined with price action analysis and other technical tools.
The indicator is free to download and easy to install on MT5, making it accessible to traders of all experience levels.
For more free MT5 indicators and trading tools, visit IndicatorForest.com.
FAQ
1 Download
Published:
Nov 13, 2025 21:35 PM
Category: