Unlocking Precise Trend Analysis with the Trends CCI Indicator
Navigating the volatile waters of the Forex and CFD markets requires an analytical framework that separates clear market momentum from temporary noise. While classic momentum indicators often lag behind fast Price Action, advanced trading frameworks like Ken Wood's Woodies CCI have revolutionized how traders view market velocity. The Trends CCI indicator builds on this proven methodology, offering an all-in-one visual solution designed to detect trend directions, identify exhausting pullbacks, and find precision entry points.
What is the Trends CCI Indicator?
The standard Commodity Channel Index (CCI) measures the current price level relative to an average price level over a given period of time. However, trading with a raw CCI line can lead to over-trading due to frequent midline whipsaws.
The Trends CCI indicator solves this by introducing a multi-layered histogram system directly into your MetaTrader platform. It transforms raw momentum data into a highly structured visual guide, utilizing dynamic color changes to represent the underlying market phase. By focusing on the zero-line cross and specific time-based holding patterns, it helps traders accurately identify whether a trend is establishing itself, continuing, or preparing for an aggressive reversal.
Understanding the Visual Signals
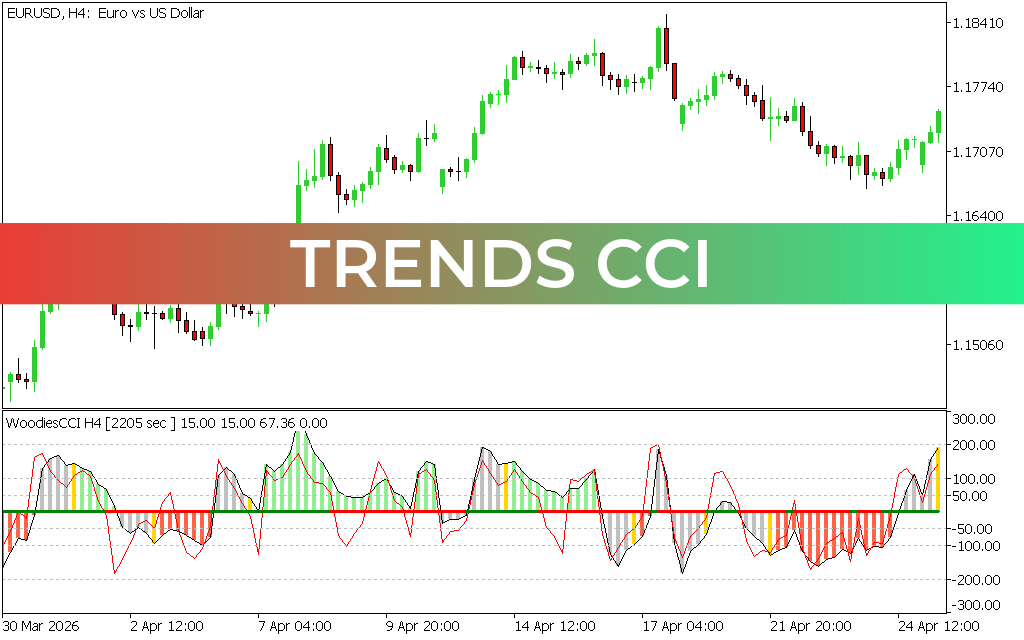
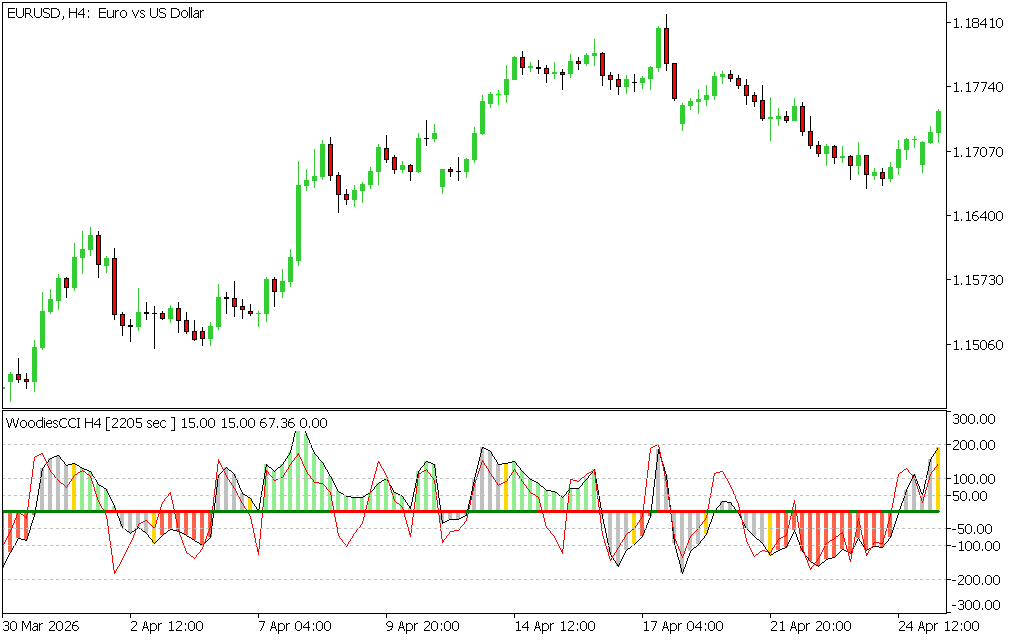
As demonstrated on a standard 4-hour (H4) chart, the Trends CCI operates in its own sub-window beneath the main price action, creating a clean roadmap for technical analysts:
- Bullish Dominance (Green Histograms): When the indicator establishes a sustained position above the zero line, the bars turn bright green. This visual cue tells traders that the buyers have control, validating long entries and trend-following strategies.
- Bearish Dominance (Red Histograms): When momentum shifts below the zero line, the histogram prints distinct red bars, signaling a dominant downtrend where short positions carry the highest mathematical probability.
- Transition & Neutral Zones (Gray and Yellow Bars): Unlike binary indicators, the Trends CCI features gray and yellow transitional bars. These alert traders to periods of market hesitation, temporary pullbacks, or potential trend-change warnings before they reflect in the price candles.
The twin boundary lines (typically set at $+100$ and $-100$) serve as critical overbought and oversold thresholds, helping traders avoid the common pitfall of chasing extended moves.
Strategic Application in Live Markets
To get the most out of the Trends CCI, it is best utilized for two primary setups:
- Zero-Line Rejections: In a strong uptrend, watch for the CCI line to pull back toward the zero line without crossing it permanently. When the histogram flashes a transition color and immediately prints a fresh green bar, it confirms a high-probability continuation entry.
- Trend Breakouts: A clean crossover from deep negative territory straight through the $+100$ line signifies an explosive influx of institutional volume, offering an early seat on a macro Trend Reversal.
By combining psychological extreme zones with structured momentum filtering, the Trends CCI indicator empowers traders to execute setups with rule-based confidence.
3 Downloads
Last Update:
May 21, 2026 02:23 AM
Published:
Jan 18, 2026 14:13 PM
Category: