Master Trend Identification with the Higher Highs & Lower Lows Indicator
In the complex world of technical analysis, the ability to objectively identify Market Structure is the difference between a winning strategy and a losing one. Traders often struggle with the subjectivity of "eyeballing" trends, leading to inconsistent entries and exits. The Higher Highs & Lower Lows indicator is a powerful tool designed to remove this guesswork by quantifying price exhaustion and trend direction through a specialized momentum-based oscillator.
What is the Higher Highs & Lower Lows Indicator?
The Higher Highs & Lower Lows indicator is a technical oscillator that plots two distinct lines in a sub-window below your main chart. It functions by tracking the frequency and magnitude of new price peaks and troughs over a specific lookback period. Unlike a standard RSI or Stochastic that measures price velocity, this tool focuses on the structural integrity of the current trend.
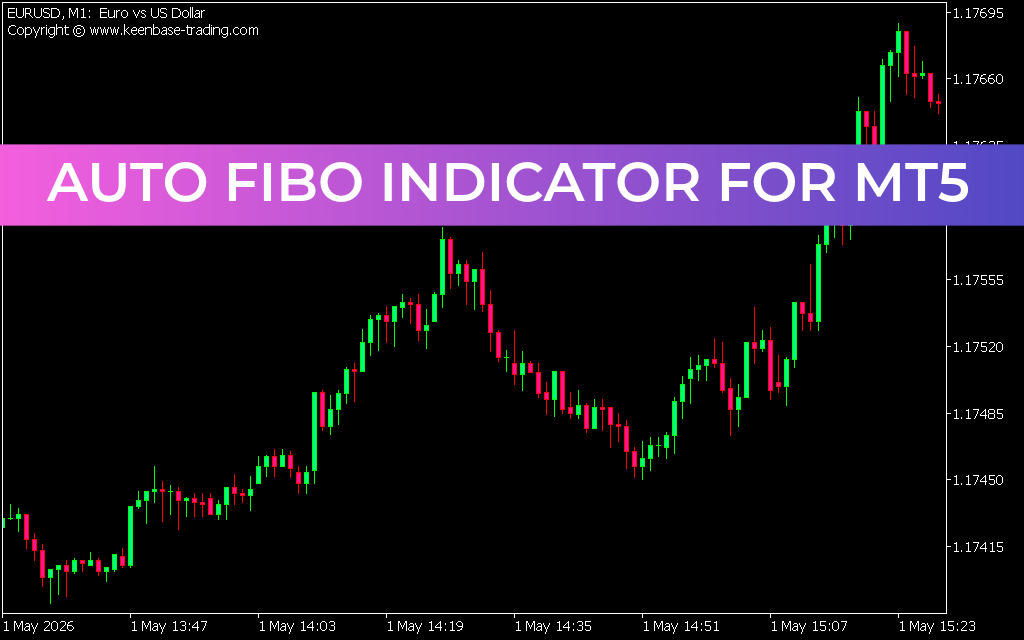
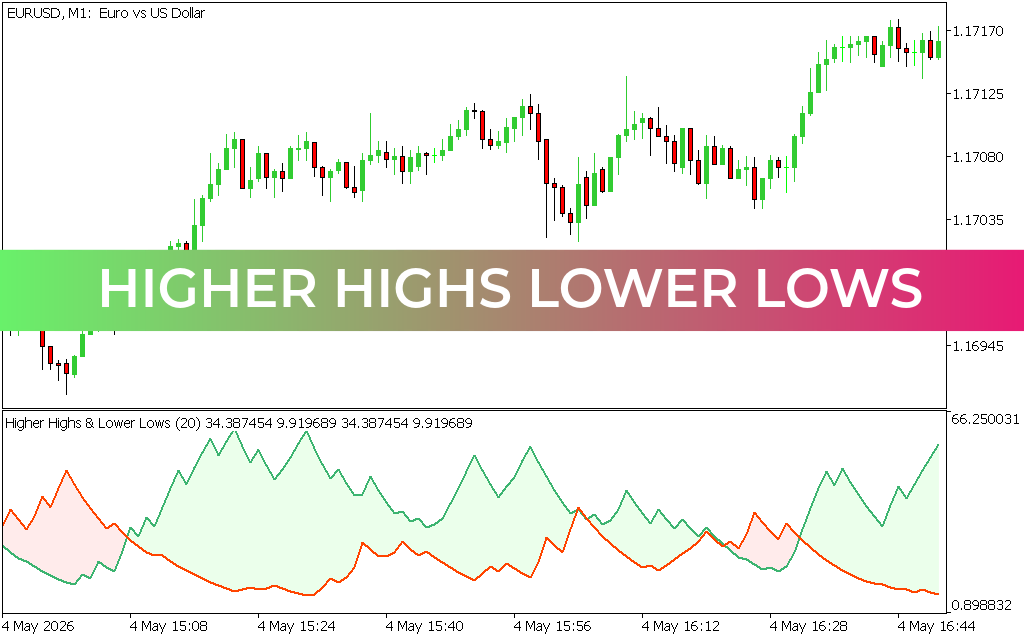
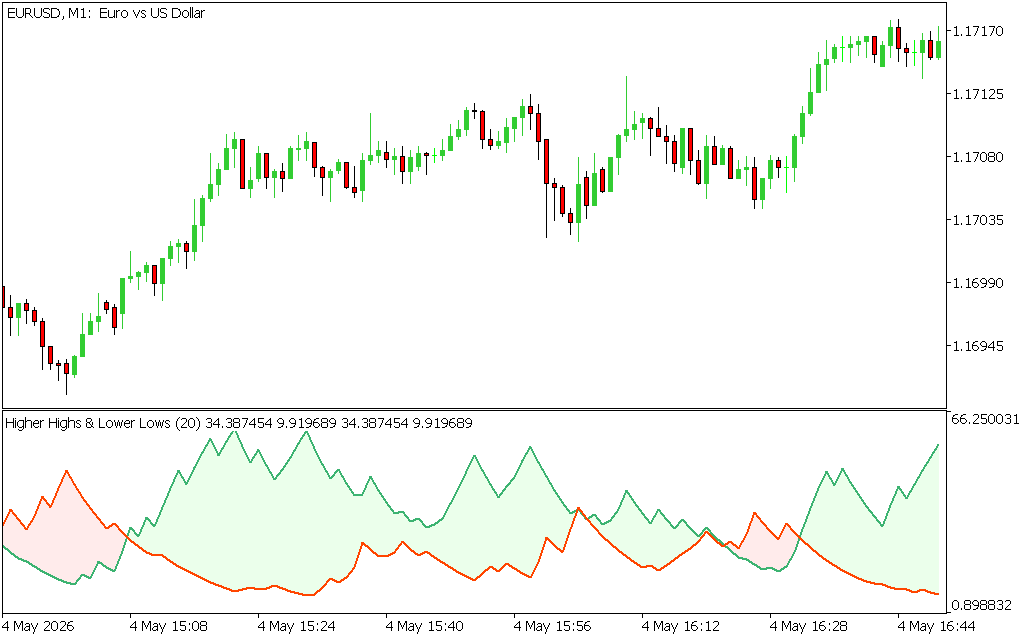
As shown in the file EURUSDM1.png, the indicator uses a green line to represent the strength of higher highs (bullish momentum) and an orange line to represent the strength of lower lows (bearish momentum). The shaded areas between these lines provide a visual representation of which side of the market is currently dominant.
Key Trading Features
- Objective Trend Confirmation: A rising green line that stays above the orange line confirms a healthy bullish trend. Conversely, when the orange line dominates, it signals a firm bearish trend.
- Momentum Exhaustion: When the dominant line begins to slope downward even as price continues its move, it can signal a "divergence"—suggesting the current trend is losing steam and a reversal may be imminent.
- Crossover Signals: The most direct signals occur when the green and orange lines cross. In EURUSDM1.png, you can observe how these crossovers often precede significant shifts in intraday price direction.
- Visual Simplicity: The colored shaded regions make it easy for traders to see at a glance whether they should be looking for buy setups or sell setups, reducing cognitive fatigue during long trading sessions.
How to Trade with Higher Highs & Lower Lows
To maximize the effectiveness of this indicator, it should be used as a confluence filter. For example, in a bullish scenario, a trader would look for the green line to cross above the orange line while the price is supported by a key moving average or psychological level.
Because the indicator tracks highs and lows over a set period (such as the default 20-period setting shown in the image), it is exceptionally useful for scalpers and day traders working on lower timeframes like the M1 or M5. It helps filter out minor "noise" and focuses on whether the market is truly making progress in a specific direction.
Conclusion
The Higher Highs & Lower Lows indicator is an essential addition to any technical trader’s toolkit. By translating raw Price Action into two easy-to-read momentum lines, it provides the clarity needed to navigate volatile markets with confidence. Whether you are looking to catch a trend at its inception or exit before a reversal, this indicator offers the objective data required for professional-grade market analysis.
6 Downloads
Last Update:
May 05, 2026 00:37 AM
Published:
Jan 27, 2026 22:00 PM
Category: